The Bearish Engulfing pattern is a two-candlestick formation that holds significance in technical analysis as a potential reversal signal. It occurs within an uptrend and suggests a potential transition to a downtrend.
The Bearish Engulfing pattern is considered a strong reversal signal due to the drastic change in sentiment it represents. Traders interpret this pattern as a warning of a potential trend reversal from bullish to bearish, prompting them to consider taking short positions or exiting long positions.
Bearish Engulfing Candlestick Pattern
The Bearish Engulfing Candlestick Pattern is a two-day candle pattern that often indicates a potential bearish reversal in an uptrend.
It’s formed when a small bullish candlestick is followed by a larger bearish candlestick, completely engulfing the body of the preceding candle. This pattern suggests the likelihood of a change in market sentiment from bullish to bearish.
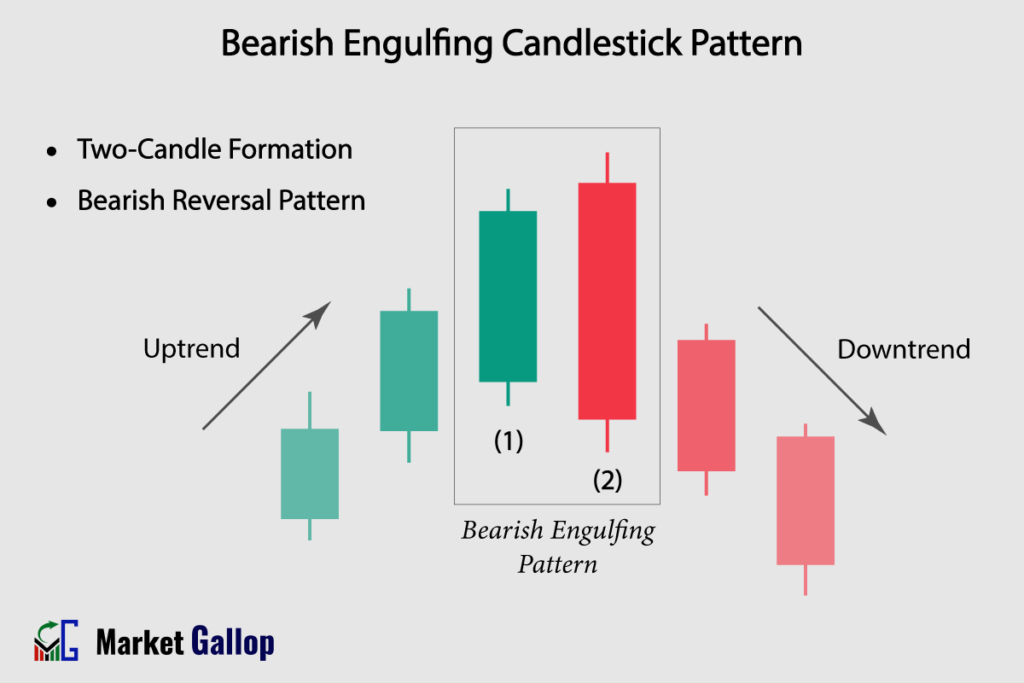
Bearish Engulfing Pattern – Formation
The Bearish Engulfing pattern is a two-candle reversal formation.
First Candlestick (Bullish): The first candle is a bullish (green) candlestick with a small body. This candle suggests that buyers held dominance during the session, pushing prices upward.
Second Candlestick (Bearish): The second candle is a bearish (red) candlestick with a larger body than the first candle. The entire body of the bearish candle “engulfs” the body of the first candle.
Rules of Identification
Prior Trend: The market should be in a clear uptrend before the Bearish Engulfing pattern occurs.
First Candle: The first candle should be a bullish (green) candlestick.
Second Candle:The second candle should be a bearish (red) candlestick with a larger real body than the first candle. The real body of the second candle should completely engulf the real body of the first candle.
Color:The color of the first candle must be green, and the second candle must be red.
Shadows: The primary focus of the pattern is on the candle bodies. Small shadows are not important.
Market Psychology
The presence of a small-bodied bullish candlestick as the first candle indicates that buyers were active during the initial trading session. This candle suggests that there was an attempt by buyers to maintain or extend the existing bullish momentum, resulting in a higher closing price compared to the open. However, the relatively small body also implies that buyers’ strength might be waning or encountering resistance.
The second candle, which is larger and bearish, is where the psychological shift occurs. The body of this candle engulfs or completely covers the body of the first bullish candle. This phenomenon reflects a dramatic shift in market sentiment from bullish to bearish. The larger body of the bearish candle indicates that sellers have taken control, overpowering the earlier buying momentum.
The Bearish Engulfing pattern indicates a shift in the balance of power from buyers to sellers. It suggests that after a period of bullish sentiment, a sudden influx of selling pressure has taken over, leading to the engulfing of the prior bullish candle. This formation is often interpreted as a sign that the uptrend might be losing its momentum and could potentially reverse into a downtrend. Traders often interpret this pattern as a signal to enter short (sell) positions or to close existing long (buy) positions.
How to Trade Bearish Engulfing Pattern
- Identify the Uptrend: Before looking for Bearish Engulfing patterns, make sure there is a clear and established uptrend in the price chart.
- Wait for a Bearish Engulfing Pattern to Emerge: Wait for the completion of candles 1 and 2.
- Entry: Once the pattern is confirmed, observe the behavior of the 3rd candle. Once the 3rd candle breaches the lowest low of candles 1 & 2, the entry is triggered. However, more conservative traders should wait for the close of the 3rd candle. If the close of the 3rd candle is below the lowest low of candles 1 & 2, the entry is confirmed.
- Set Stop-Loss: Traders may set stop-loss above the highest high of candles 1 and 2.
Traders often use additional technical analysis tools, such as key support levels, trendlines, and technical indicators, to confirm the validity of the pattern.
Trigger: When the third candle’s price breaches the low of the engulfing candle.
Confirmation: The third candle should close below the low of the entire engulfing pattern.
Stop-loss: Just above the high of the entire engulfing pattern.
Reliability of the Pattern
The Bearish Engulfing pattern is more reliable when it appears after a prolonged uptrend, indicating a potential trend reversal. Its reliability increases when the pattern forms near key resistance levels.
While the Bearish Engulfing pattern suggests a potential bearish reversal, it’s important to note that not all instances will lead to a substantial trend change. Often it may lead to only short-term reversals or minor retracements within a larger uptrend.
Bearish Engulfing patterns appearing on higher timeframes (weekly or monthly) are more reliable. Combining the pattern with other technical analysis tools can help increase its effectiveness as a trading signal.
Gallop Insights
Combining the Bearish Engulfing pattern with other technical analysis tools can enhance the accuracy of trading decisions.
For better results:
- Look for Bearish Engulfing pattern at key levels (support & resistance levels)
- Wait for confirmation of pattern, i.e., till the close of 3rd candle.
- It should be used in combination with other technical analysis tools and indicators.