Imagine a scenario: a downtrend has been prevailing, with bears firmly in control. Suddenly, a shift occurs – the bears’ dominance is challenged, and bulls seize an opportunity to make their presence felt. This situation is what the Piercing Line candlestick pattern captures.
A Piercing Line is a potential bullish reversal pattern. The corresponding bearish pattern is called Dark Cloud Cover. In this article, we will discuss about the bullish version – the Piercing Line.
Piercing Line Candlestick Pattern
The Piercing Line Candlestick Pattern is a two-day candle formation that suggests a potential reversal from a downtrend to an uptrend.
It’s formed when a bearish candlestick is followed by a bullish candlestick that pierces into the body of the bearish candle and closes at least halfway into the body of the first candle. This pattern indicates a possible shift in market sentiment from bearish to bullish.
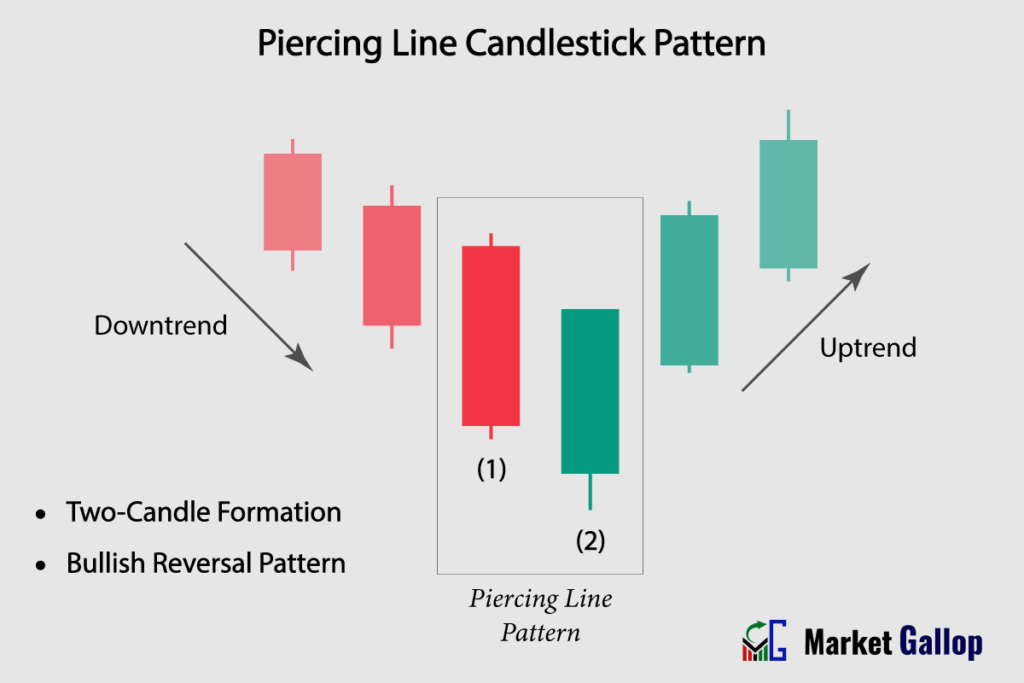
Piercing Line Pattern – Formation
Piercing Line pattern is a two-candle reversal formation.
First Candlestick (Bearish): The first candle is a bearish (red) candlestick and have a substantial bearish body. This candle indicates that sellers were in control during the session, pushing prices lower. It represents a continuation of the existing downtrend.
Second Candlestick (Bullish): The second candle should be bullish (green). It opens below the low of the first candle. The bullish candle’s closing price should be above the midpoint (50%) of the first candle’s body.
Rules of Identification
Prior Trend: The market should be in a clear downtrend before the Piercing Line pattern occurs.
First Candle: The first candle should be a bearish (red) candlestick and reflects the continuation of the downtrend.
Second Candle:The second candle should be a bullish (green) candlestick and opens below the low of the first candle but closes above the midpoint of the first candle’s body. The body of the bullish candle should ideally be larger than the body of the first bearish candle.
Color: The color of the first candle must be red, and the second candle must be green.
Shadows: The primary focus of the pattern is on the candle bodies. Small shadows can be neglected.
Market Psychology
The Piercing Line pattern indicates a potential shift in market sentiment from bearish to bullish. The bullish candle’s ability to penetrate the bearish candle’s territory suggests that buyers are stepping in with increased strength, potentially leading to a trend reversal.
- The first bearish candle demonstrates the existing downtrend and the dominance of sellers.
- The second bullish candle opens lower than the previous candle’s low, indicating continued bearish sentiment at the beginning of the session.
- However, the bullish candle manages to reverse direction and close significantly higher than its open, showing strong buying interest.
How to Trade Piercing Line Pattern
- Identify the Downtrend: Before looking for Piercing Line pattern, make sure there is a clear and established downtrend in the price chart.
- Wait for a Piercing Line Pattern to Emerge: Wait for the completion of candles 1 and 2.
- Entry: Once the pattern is confirmed, observe the behavior of the subsequent candles. Once the highest high of candles 1 & 2 is breached, the entry is triggered. However, more conservative traders should wait for subsequent candles to close. Once a subsequent candle close above the highest high of candles 1 & 2, the entry is confirmed.
- Set Stop-Loss: Traders may set stop-loss below the lowest low of candles 1 and 2.
Traders often use additional technical analysis tools, such as key support levels, trendlines, volume analysis and technical indicators to validate the potential reversal signaled by the Piercing Line pattern. This helps reduce the risk of false signals and enhances the pattern’s overall reliability.
Trigger: When the price of subsequent candles breaches the high of the entire piercing pattern.
Confirmation: Subsequent candles must close above the high the entire piercing pattern.
Stop-loss: Just below the low of the entire piercing pattern.
Reliability of the Pattern
The Piercing Line pattern demonstrates a higher level of bullishness in comparison to the Bullish Meeting Line. However, it is not as strongly bullish as the Bullish Engulfing pattern.
The patterns appearing on higher timeframes (weekly or monthly) are more reliable. Watch out for such patterns appearing near key support levels.
Combining the Piercing Line with support levels, trendlines, and other Technical Analysis tools can enhance its reliability.
Gallop Insights
For better results:
- Look for Piercing Line pattern at key levels (support & resistance levels)
- Wait for confirmation of pattern, i.e., close of a subsequent candle above the highest high of the pattern.
- The pattern should not be used in isolation. Use it in conjunction with other technical analysis tools and indicators.