A Heikin Ashi chart is a charting technique used in the stock market and technical analysis to represent the price movements of securities. Heikin-Ashi charts offer a smoothed view of price movements by employing a specific formula that averages the values of the previous and current candles. They are particularly useful for traders and investors who aim to identify and follow trends while filtering out some of the noise and volatility present in other traditional charts.
What is a Heikin Ashi Chart?
A Heikin Ashi chart is a type of candlestick chart used in financial markets, including stocks, commodities, or currencies, to represent the price movement of a security over a specific time period.
These charts are essentially a variation of the traditional Japanese candlestick chart. However, unlike traditional candlestick charts, Heikin Ashi charts use modified calculations for each candle’s open, high, low, and close prices.
“Heikin Ashi” is a Japanese term that translates to “average bar” or “average pace” in English, indicating its focus on smoothing out price fluctuations.
By incorporating the values of the prior candles and averaging prices while generating new candles, Heikin Ashi charts aim to provide a smoothed representation of price trends. This reduces the impact of market noise and helps traders identify the prevailing trend direction more easily.
Since each candle’s open is influenced by the values of the prior candle, unlike candlestick charts, these charts also reduce the occurrence of gaps between candles. This can make trends appear more continuous.
On the flip side, due to this smoothing effect, these charts usually lag in reacting to sudden market changes.

Heikin Ashi Candles
A Heikin Ashi candle is constructed based on the average prices of the current period, incorporating data from the previous candle.
Each Heikin Ashi candle represents the modified price movement during a specific time period, such as a minute, an hour, a day, or a week. For example, in an hourly Heikin Ashi chart, each candle summarizes the modified price action over one hour. In a daily Heikin Ashi chart, each candle reflects the modified price movement within a single trading day.

Heikin Ashi candles, when viewed individually, appear similar to traditional Japanese candlesticks. The structure (body and wicks or shadows) of individual candles in these two charting techniques is indeed the same. However, they are entirely different from one another.
The price shown on a normal candlestick chart will also be the actual price at which the asset would have traded or is currently trading. But since Heikin Ashi is using a modified formula to generate candles, the prices shown on a Heikin Ashi candle may not match the actual price at which the asset would have traded or is currently trading.
Heikin Ashi candles are a modified version of traditional Candlestick charts. A standard Japanese candlestick consists of four pieces of information – Open, High, Low, and Close prices of an asset.
In contrast, Heikin Ashi charts use a modified formula to derive the current candle. The Open, High, Low, and Close of Heikin Ashi candles are constructed from the information of the current and previous candles.
Body and Wicks (Shadows)
Similar to traditional Japanese candlesticks, the candles in Heikin Ashi charts also consist of two components: the body and the wicks (or shadows).
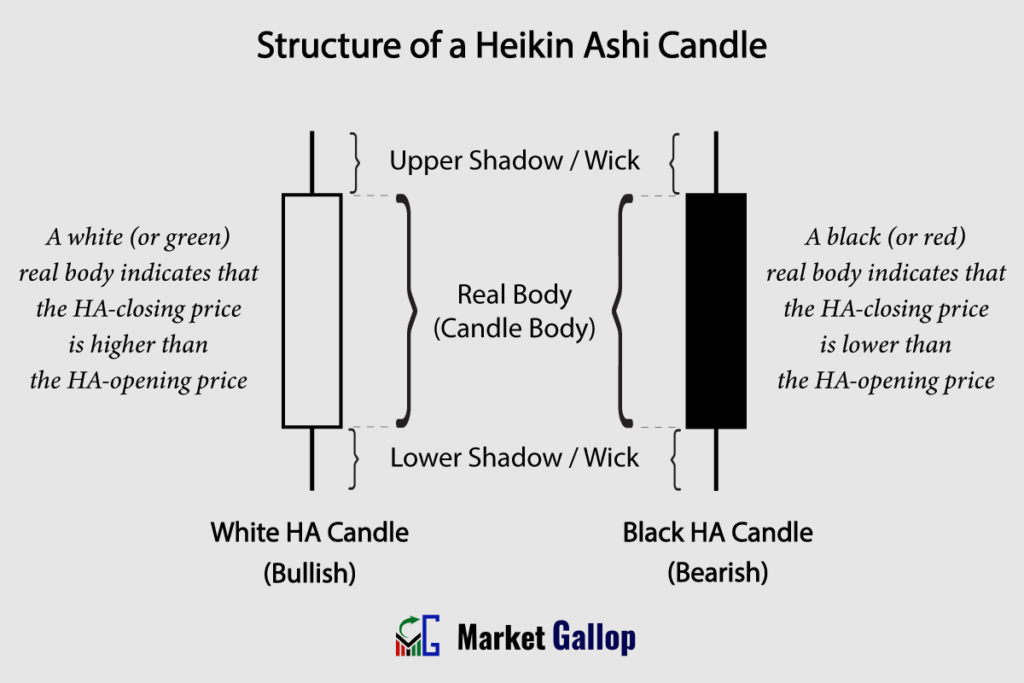
Body: The rectangular area in the middle of the candle represents the range between the calculated Heikin Ashi opening and closing values during the time period.
Wicks or Shadows: These are thin lines extending above and below the body to represent the high and low prices reached during the specified time period. The upper wick extends from the top of the body to the high price, while the lower wick extends from the bottom of the body to the low price.
Unlike traditional Japanese candlesticks, the candle bodies do not show the actual opening and closing prices. Instead, these values are derived from the actual price information and prior candles, as explained later in this article.
Color-Coding
Similar to traditional candlestick charts, Heikin Ashi candles are typically color-coded for easy interpretation and visual clarity. The colors are usually used to represent bullish and bearish price movements.
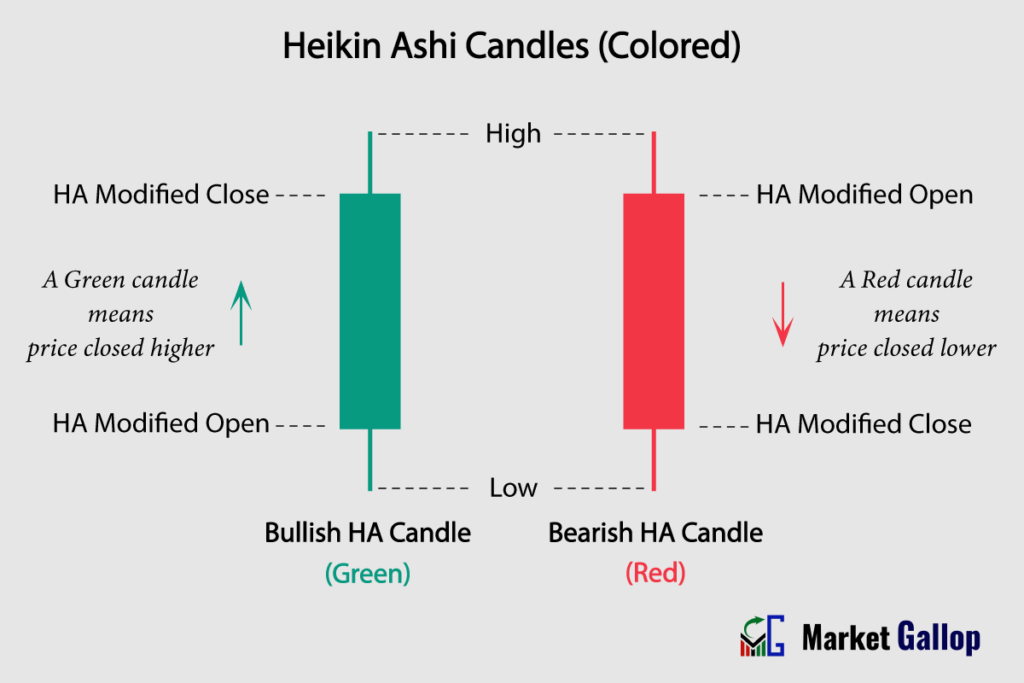
- Green (or White) for a Bullish Heikin Ashi Candle: When the derived closing price is higher than the derived opening price, the body is typically colored green or white.
- Red (or Black) for a Bearish Heikin Ashi Candle: When the derived closing price is lower than the derived opening price, the body is typically colored red or black.
Open, Close, High, and Low
The opening, closing, high, and low prices of every new Heikin Ashi candle are calculated based on the price data corresponding to the current time period and the prior Heikin Ashi candle.
- The open price of the current candle is the average of the previous candle’s open and close.
- The close price is the average of the current period’s open, close, high, and low.
- The high prices are determined by the highest values in the current period.
- The low prices are determined by the lowest values in the current period.

Heikin Ashi Formula
As discussed above, the formulas to calculate modified values for OHLC (Open, High, Low, and Close) data to construct a new Heikin Ashi candle are:
Open (HA-Open)
HA-Open is the average of the previous period’s HA-Open and HA-Close.
Open = (open of previous HA candle + close of previous HA candle) / 2
Close (HA-Close)
HA-Close is the average of the current period’s open, close, high, and low prices.
Close = (Open + Close + High + Close) / 4
High (HA-High)
HA-High is the maximum value among the current period’s high, HA-Close, and HA-Open.
High = Max [High, Open, Close]
Low (HA-Low)
HA-Low is the minimum value among the current period’s low, HA-Close, and HA-Open.
Low = Min [Low, Open, Close]

Since the open of a new candle is calculated as the average of the previous candle’s open and close, every new Heikin Ashi candle opens at the middle level between the opening and closing prices of the previous candle.
Heikin Ashi Calculation
Let’s consider a hypothetical stock with the following prices for a given period:
- Open: $50
- Close: $60
- High: $65
- Low: $45
- Previous HA-Open: $55
- Previous HA-Close: $52
Now, let’s calculate the values for the new Heikin Ashi Candle.
HA-Open = (55+52) / 2 = 53.5
HA-Close = (50+60+65+45) / 4 = 55
HA-High = 65
HA-Low = 45
Observe the opening and closing values of the new Heikin Ashi Candle.
| OHLC values (Actual) | OHLC values in Heikin Ashi Candle | |
|---|---|---|
| Open | 50 | 53.5 |
| Close | 60 | 55 |
| High | 65 | 65 |
| Low | 45 | 45 |
As discussed earlier, Heikin Ashi candles do not display the actual opening and closing prices.
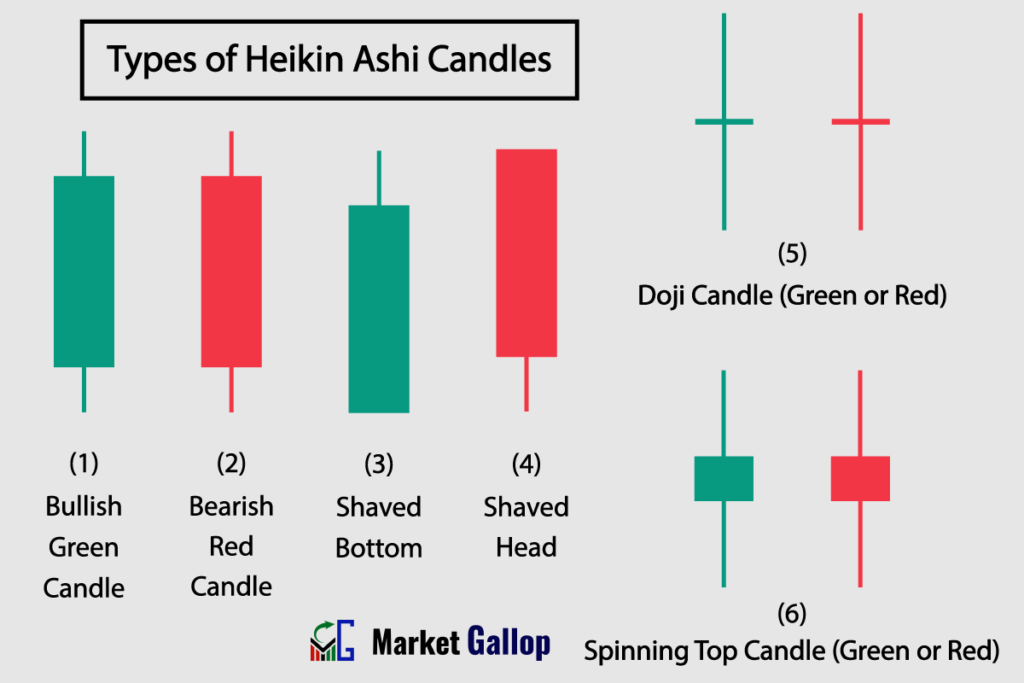
Important Heikin Ashi Candle Types
Different types of Heikin Ashi candles exist, similar to traditional candlesticks. There are six major candle types that are important in the analysis of a Heikin Ashi chart.
1. Bullish (Green or White) Candle
- Color: Green or white.
- Characteristics: The HA-close is higher than the HA-open, indicating bullish sentiment. This type of candle suggests upward momentum and is often part of an uptrend. Traders may see it as a signal to continue buying or hold existing long positions.
2. Bearish (Red or Black) Candle
- Color: Red or black.
- Characteristics: The HA-close is lower than the HA-open, signaling bearish sentiment. This candle type suggests downward pressure and is often part of a downtrend. Traders may interpret it as a signal to consider short positions.
3. Shaved Bottom
- Color: Green or white, with no lower shadow.
- Characteristics: Shaved Bottoms are bullish candles with no lower shadow. They suggest that buyers controlled the market from the opening to the closing, potentially signaling a strong uptrend.
4. Shaved Head
- Color: Red or black, with no upper shadow.
- Characteristics: Shaved Heads are bearish candles with no upper shadow. They suggest that sellers dominated the market from the opening to the closing, potentially signaling a strong downtrend.
5. Doji Candle
- Color: The color is irrelevant. Minimal to no real body and significant upper and lower shadows.
- Characteristics: The HA-open and HA-close prices are very close or identical, resulting in a candle with minimal or no real body. This type indicates indecision in the market, and traders might interpret it as a potential reversal signal or a period of consolidation.
6. Spinning Top Candle
- Color: The color is irrelevant. Small real body and significant upper and lower shadows.
- Characteristics: The HA-open and HA-close are close together, but the candle has substantial upper and lower shadows. This type reflects uncertainty and a battle between buyers and sellers. Traders may view it as a signal that the market is undecided about the next trend direction.
Origin of Heikin Ashi
The history of the Heikin Ashi chart can be traced back to Munehisa Homma, an 18th-century Japanese rice trader. Homma, often considered the father of candlestick charting, used candlestick patterns to analyze price movements in the rice markets. While traditional candlestick charts provided valuable insights, the Heikin-Ashi chart was later developed to further reduce market noise and emphasize trends. Later, it became popular in trading other financial securities, including stocks.
Introduced to the Western world by author and technical analyst Dan Valcu in the early 2000s, Heikin-Ashi charts gained popularity for their ability to filter out short-term fluctuations and highlight prevailing trends. Traders often use Heikin-Ashi charts alongside traditional candlestick charts to enhance their technical analysis and make more informed trading decisions.
How to Read Heikin Ashi Charts
First of all, understand the basic elements of a Heikin Ashi chart that have already been discussed. Now, we will delve into the Heikin Ashi candle patterns or primary signals generated by a Heikin Ashi Chart. In the end, we will discuss how to use Heikin Ashi charts for:
- Trend Identification
- Finding Support and Resistance Levels
- Drawing Trendlines and Channels
- Identifying Chart Patterns
Heikin Ashi Candle Patterns (Primary Signals)
There are six primary signals associated with a Heikin Ashi chart:
Multiple Green (White) candles indicate an uptrend.
In Heikin Ashi charts, a green or white candle represents a bullish period, where the closing price is higher than the opening price. A series of such candles suggests a consistent upward movement in the price of the financial instrument.
Series of big Shaved Bottoms indicate a strong uptrend.
A Shaved Bottom refers to a green or white candle with no lower shadow, indicating that the price opened and stayed above the midpoint of the prior Heikin Ashi candle. A series of shaved bottoms, particularly large in size, suggests a strong uptrend where buyers have been in control throughout the period, driving prices higher.
Multiple Red (Black) candles indicate a downtrend.
In Heikin Ashi charts, a red or black candle represents a bearish period, where the closing price is lower than the opening price. Continuous red candles indicate a sustained downward movement in the price.
Series of big Shaved Heads indicate a strong downtrend.
A Shaved Head refers to a red or black candle with no upper shadow, indicating that the price opened and stayed below the midpoint of the prior Heikin Ashi candle. A series of shaved heads, particularly large in size, suggests a strong downtrend where sellers dominated the market throughout the period, driving prices lower.

Doji candles (irrespective of color) indicate indecision (trend pause or trend reversal).
Regardless of its color, a Doji suggests indecision in the market. It could indicate a temporary pause in the current trend or a potential reversal, where buyers and sellers are in equilibrium.
Spinning Top candles (irrespective of color) indicate indecision (trend pause or trend reversal).
Similar to Doji candles, Spinning Tops signal indecision in the market. They suggest a balance between buyers and sellers, potentially leading to a pause in the current trend or a reversal.
Trend Identification
Uptrend
To identify an uptrend in Heikin Ashi charts, look for a sequence of candles that creates a pattern of higher highs and higher lows.
In the following chart for Intel Corporation (INTC), observe how Heikin Ashi candles behave.

Observe the consistent formation of higher highs and higher lows in the above chart, indicating the presence of an uptrend during the shown period.
Downtrend
To identify a downtrend in Heikin Ashi charts, search for a sequence of candles that creates a pattern of lower highs and lower lows.
Observe the chart below for Micron Technology (MU).

A downtrend is identifiable in the above chart. Take note of how Heikin Ashi candles form lower highs and lower lows.
Sideways or Range-Bound
In sideways or range-bound markets, there is no clear bullish or bearish bias, and prices are moving within a certain range.
A Heikin Ashi chart for Amazon (AMZN) is given below.
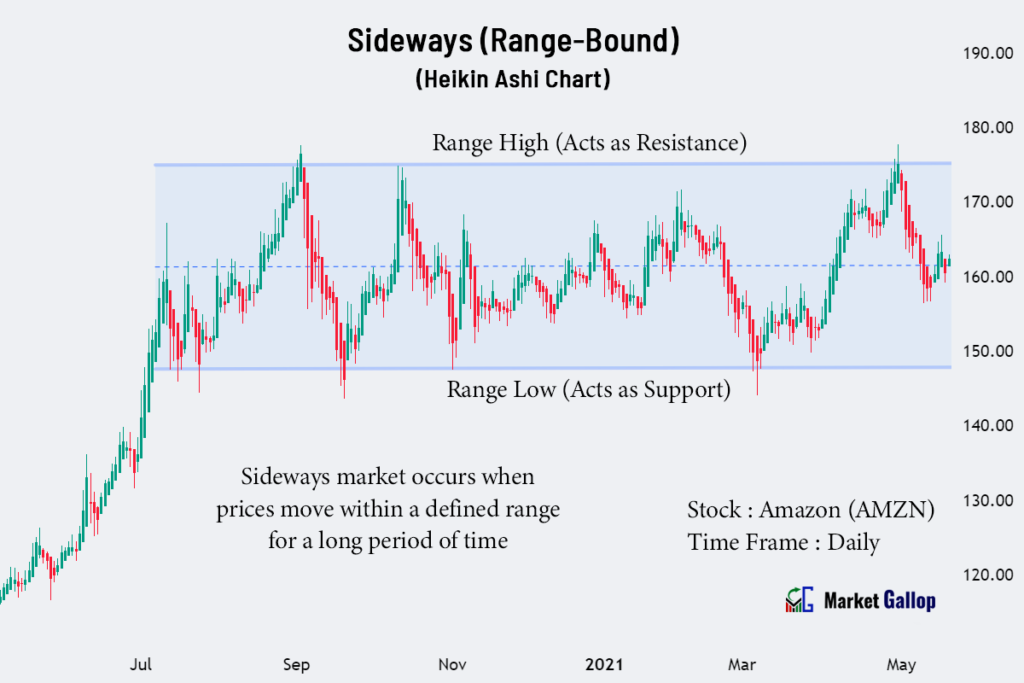
Notice the sideways movement of prices since mid-July. Without any clear-cut trend, prices consistently fluctuate in the vicinity of $150 to $175 over the course of several months.
Trendlines and Channels
Trendlines
Trendlines are drawn on Heikin Ashi charts to connect the lows or highs of price movements. They help to visualize the slope and strength of a trend.
In an uptrend, an ascending trendline is drawn by connecting the swing lows. In a downtrend, a descending trendline connects the swing highs.
Below is a Heikin Ashi chart of Nvidia Corporation (NVDA).

An ascending trendline is drawn by connecting the lows of the above stock. It can be observed that the trendline is not violated even after one year.
Channels
Channels are formed by drawing parallel lines along the price movements in Heikin Ashi charts. They help traders identify the trading range and potential breakout points.
Channels can be ascending, descending, or horizontal, depending on the direction of price movement. In channels, an upper trendline connects the highs, and a lower trendline connects the lows.
Observe the chart below for Intel Corporation (INTC).

An ascending channel is observed in the above stock. The upper trendline acts as resistance, while the lower trendline acts as support. Intel continued to stay inside the channel until mid-November, when it finally managed to break out.
Support and Resistance Levels
Support Level
Support levels can be identified in a Heikin Ashi chart as price points where the candles have consistently reversed direction after reaching a low point. These levels represent areas where buying interest tends to increase, preventing further price declines.

In the above chart for Johnson & Johnson (JNJ), the $157-$159 range acts as a support zone. Every time the price drops to this range, the buyers step up and push the price higher.
Resistance Level
Resistance levels are price points where the Heikin Ashi candles have consistently changed direction after reaching a high point. These levels represent areas where selling interest intensifies, preventing further price increases.
The following is a Heikin Ashi chart for Broadcom (AVGO).

Whenever the price reaches around $910, sellers push the price lower. Broadcom finally breaches the resistance level in the November month. Observe how the previous resistance level later acts as a support level.
Chart Patterns
Reversal Patterns
Chart patterns, such as head and shoulders, double tops, double bottoms, rounding tops, and bottoms, can be observed on Heikin Ashi charts. These patterns indicate a potential trend reversal.
The following chart shows a reversal pattern formed in Visa (V) stock.
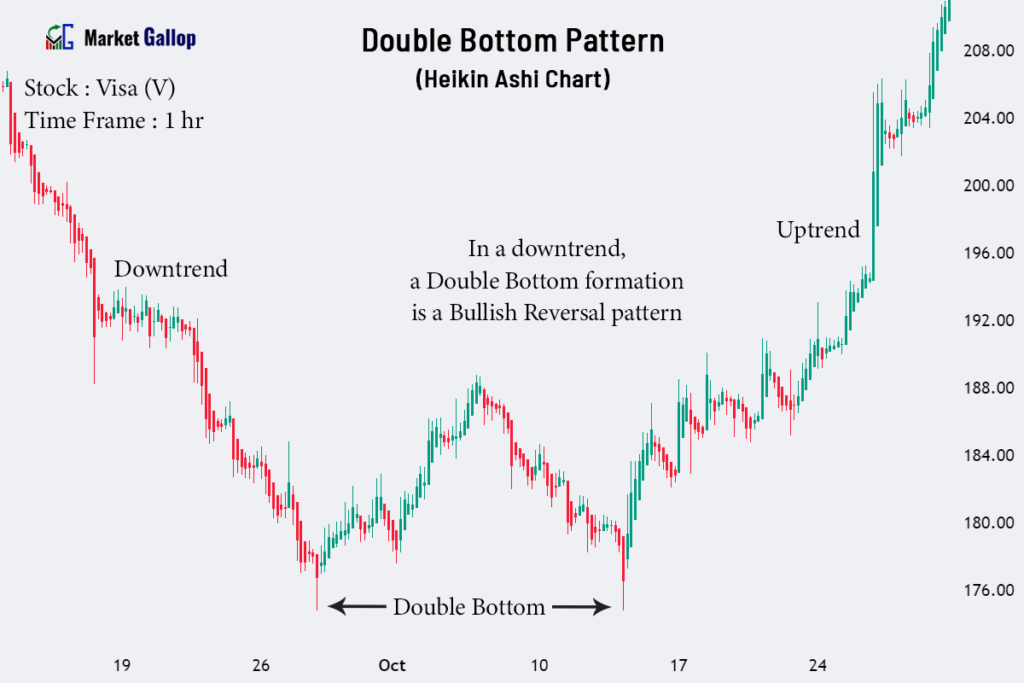
The Visa stock was in a prior downtrend. The stock later forms a double bottom pattern. When found in a downtrend, a double bottom formation is a bullish reversal pattern. In the above case, the pattern is validated once the price breaks above the neckline.
Continuation Patterns
Continuation patterns, such as cup and handle, bull flags, bear flags, bullish pennants, and bearish pennants, are also visible in Heikin Ashi charts. These patterns indicate that the prevailing trend is likely to continue.
A Heikin Ashi chart for Costco (COST) is given below.
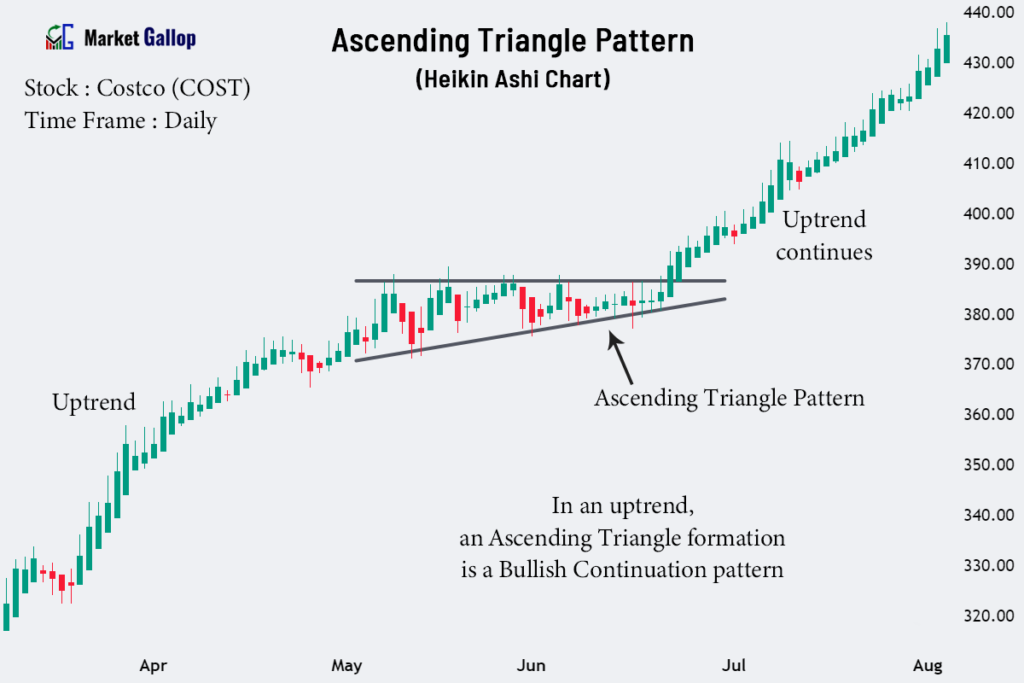
In the above chart, an ascending triangle pattern is formed after an uptrend. This formation is a bullish continuation pattern when found in uptrends. The pattern is validated once the price breaks above the triangle.