The Rising Three Methods candlestick pattern is a bullish continuation pattern that occurs in technical analysis, indicating a potential continuation of an uptrend. It unfolds after a significant rally in the market, during which a phase of profit-taking ensues. This prompts a minor correction in prices, but it’s essential to note that this correction doesn’t mark a significant shift in the overall trend. Instead, it serves as a moment of temporary consolidation, where the market appears to pause and catch its breath.
Around the final day of this pattern’s development, a renewed surge of buyer interest becomes apparent. This resurgence in buying activity propels the market upward once again, effectively continuing the established uptrend. The Rising Three Methods pattern is a testament to the temporary respite that the market experiences after a strong rally, which is then followed by a renewed bout of bullish momentum as buyers step back into the scene.
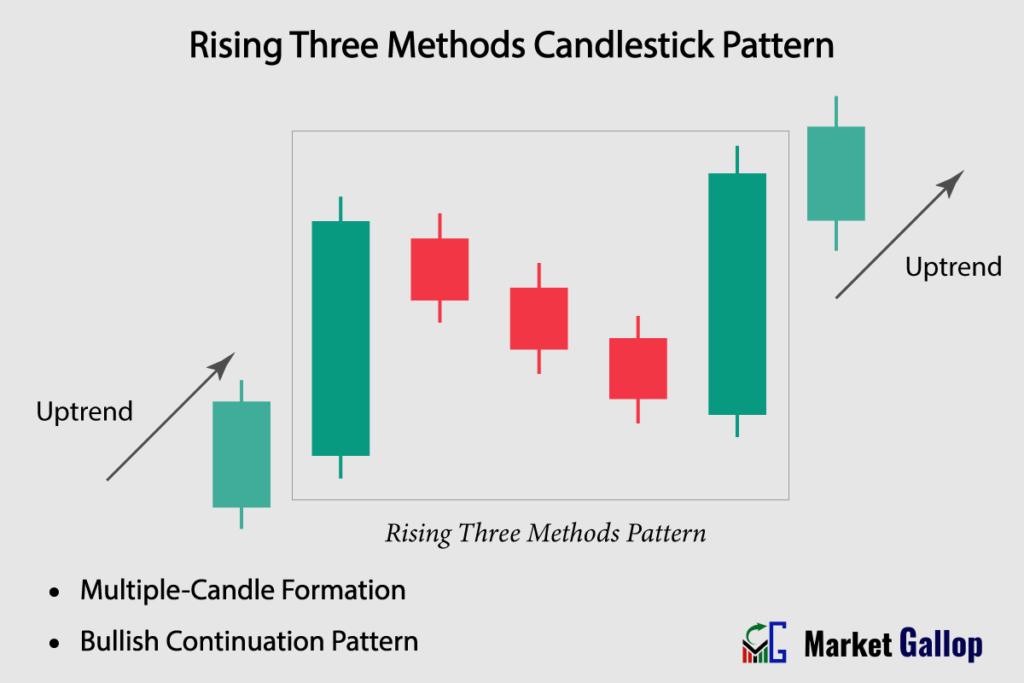
Rising Three Methods Candlestick Pattern
The Rising Three Methods is a bullish continuation candlestick pattern that occurs within a prevailing uptrend. This pattern is composed of a combination of five candlesticks (typically), one long bullish candle followed by three small bearish candles and another long bullish candle.
The Rising Three Methods pattern suggests that a brief consolidation or correction is taking place within the ongoing uptrend before the price resumes its upward movement. There is no hard and fast rule that the number of candlesticks has to be five; it can vary between three and seven. We will explain this in the below section.
The Rising Three Methods pattern is interpreted as a sign that the uptrend is still intact, and the minor consolidation is likely a temporary pause before the price continues its upward trajectory. Traders often use this pattern to reaffirm their bullish bias in an uptrending market.
The trigger for entering a trade based on the Rising Three Methods pattern is typically when the price breaks out above the high of the final bullish candlestick in the pattern. This breakout indicates that the bullish momentum is resuming, confirming the pattern’s potential continuation signal.
Rising Three Methods Pattern – Formation
The Rising Three Methods pattern is a bullish continuation formation. While it usually develops over a span of five days, it’s important to note that there is no rigid requirement for it to strictly adhere to this five-day timeframe. There are three phases within the formation: an initial bullish phase, an intermediate bearish phase, and a final bullish phase.
Initial Phase (Single Bullish Candlestick): The first candlestick is a long bullish (green) candle that represents the prevailing uptrend.
Intermediate Phase (One to Five Bearish Candlesticks): This phase consists of a sequence of smaller bearish candles that reside within the range of the first bullish candlestick. These bearish candles indicate a minor pause or consolidation in the ongoing uptrend. The number of candles in this corrective period is typically around three, although it’s important to note that there is no strict rule in this regard. The number of candles may vary from one to five, with three being the most commonly observed number in practice. This intermediate bearish phase serves as a breather within the overall pattern, allowing for a brief retraction before the final bullish push.
Final Phase (Single Bullish Candlestick): The final candlestick is a long bullish (green) candle that breaks out of the consolidation and closes above the close of the initial bullish candle.
Rules of Identification
Prior Trend: The market should be in a clear uptrend before the Rising Three Methods pattern occurs.
First Candle: The first candle should be a bullish (green) candlestick. The candle is a strong one and must close near its highs, with relatively small or no shadows on either side.
Consecutive Bearish Candles: Look for consecutive bearish candlesticks that reside within the range of the first bullish candlestick. Typically, the number of such bearish candles is found to be three, however, they can vary between one and five. They represent the consolidation phase. These bearish candles must reside within the range of the first bullish candle.
Final Candle: The final candle should be a bullish (green) candlestick. This candle breaks out of the bearish consolidation phase. This candle closes above the highest high of the initial bullish candle and the subsequent bearish candles.
Color: The color of the first and final candles must be green. The color of candles in between them are red.
Strong Upward Movement: The first and final candlesticks should display a significant upward movement, with relatively small or no lower shadows.
Higher Close: Final candlestick should close above the highest high of the initial bullish candle and the subsequent bearish candles, reflecting sustained buying pressure.
Shadows: Each of the bullish candles are strong candles, which means shadows, if present, are normally small. Small shadows on the downside can be neglected.
Market Psychology
The first long bullish candle suggests the continuation of the prevailing uptrend in the market, indicating that buyers have been dominant and able to push the price higher. This phase reflects strong bullish sentiment, where the majority of market participants are optimistic about the asset’s future prospects.
Following the strong bullish candle, the pattern enters an intermediate phase marked by a sequence of smaller bearish candles. These bearish candles is just a temporary interruption to the ongoing uptrend. While the overall sentiment remains positive due to the preceding strong bullish candle, the appearance of bearish candles within the range of the initial bullish candle indicates a minor retracement or consolidation. This phase suggests that some profit-taking or hesitancy might be occurring among traders, causing a brief pause in the upward movement.
The concluding phase of the pattern witnesses the emergence of another long bullish candle. This candle breaks out of the consolidation phase and closes above the close of the initial bullish candle. The presence of this strong bullish candle reaffirms the dominance of buyers and their determination to continue the upward trend. It signifies that the brief consolidation phase was just a temporary pause in the overall bullish momentum.
Overall, the Rising Three Methods pattern showcases a transition from a strong uptrend to a temporary consolidation phase and then a renewed bullish breakout. The sentiment shifts from bullish to cautious and back to bullish, reflecting the psychology of traders as they assess market conditions.
How to Trade Rising Three Methods Pattern
- Identify the Uptrend: Before looking for the Rising Three Methods pattern, make sure there is a clear and established uptrend in the price chart.
- Wait for a Rising Three Methods Pattern to Emerge: Wait for the completion of the pattern.
- Entry: Entry is triggered when the final bullish candle breaches the highest high of the initial bullish candle and the subsequent bearish candles. However, more conservative traders should wait for the final candle to close. Entry is confirmed at the close of the final bullish candle. There might be a slight price pullback after the final candle. Some traders may choose to wait for these pullbacks to secure a better entry point. However, pullbacks may not occur in all instances.
- Set Stop-Loss: Traders may set stop-loss below the lowest low of the intermediate bearish candles and the final bullish candle.
Traders are recommended to incorporate additional technical analysis tools, such as key support levels, trendlines, trading volumes, and technical indicators to confirm the potential continuation signal suggested by the Rising Three Methods pattern.
Trigger: When the final bullish candle breaches the highest high of the initial bullish candle and the subsequent bearish candles.
Confirmation: When the final bullish candle closes above the highest high of the initial bullish candle and the subsequent bearish candles.
Stop-loss: Just below the lowest low of the intermediate bearish candles and the final bullish candle.
Reliability of the Pattern
The Rising Three Methods pattern is more reliable when it occurs within a well-defined and strong uptrend.
Volume Confirmation: The intermediate phase of consecutive bearish candles in the pattern is characterized by decreasing volume. Now look out for a surge in trading volume as the third candle breaks out above the intermediate consolidation phase. Higher volume indicates stronger buying interest and validates the pattern’s continuation potential.
To enhance reliability, consider using other technical indicators like moving averages, trendlines, and support/resistance levels. If these indicators align with the Rising Three Methods pattern, it strengthens the overall signal. Integrating these tools into your analysis helps mitigate the chances of being misled by false signals and enhances the overall trustworthiness of the pattern’s interpretation.
Gallop Insights
For better results:
- Look for Rising Three Methods pattern at key levels (support & resistance levels)
- Wait for confirmation of pattern, i.e., close of the final bullish candle.
- The pattern should not be used in isolation. Traders should use it in conjunction with other technical analysis tools and indicators.