The Falling Three Methods candlestick pattern is a bearish continuation pattern that occurs in technical analysis, indicating a potential continuation of a downtrend.
It appears subsequent to a substantial market decline, prompting a phase of short covering. This triggers a minor price correction, but it’s crucial to note that this correction doesn’t indicate a significant shift in the overarching trend. Rather, it acts as a temporary consolidation phase, allowing the market to pause and recalibrate.
Towards the final phase of this pattern’s development, there’s a noticeable resurgence in seller interest. This renewed selling activity propels the market downwards once again, effectively sustaining the ongoing downtrend. The Falling Three Methods pattern underscores the temporary relief that the market experiences following a pronounced decline. This is then followed by a renewed surge of bearish momentum as sellers re-enter the scene, emphasizing the continuation of the prevailing downtrend.
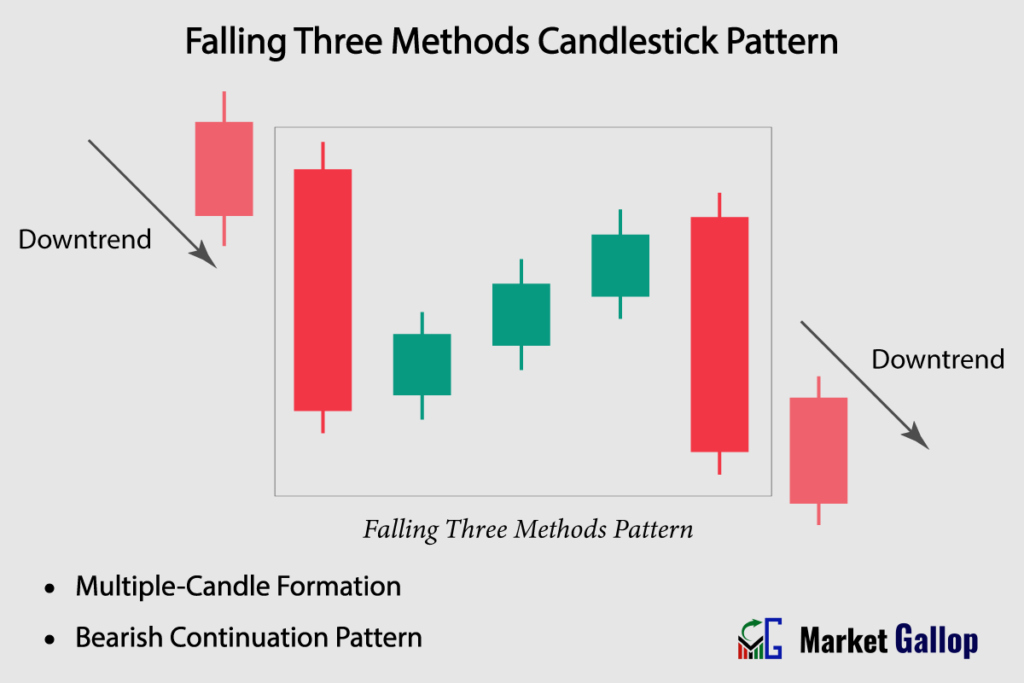
Falling Three Methods Candlestick Pattern
The Falling Three Methods is a bearish continuation candlestick pattern that occurs within a prevailing downtrend. This pattern is composed of a combination of five candlesticks (typically), one long bearish candle followed by three small bullish candles and another long bearish candle.
The Falling Three Methods pattern suggests that a brief consolidation or correction is taking place within the ongoing downtrend before the price resumes its downward movement. The number of candlesticks doesn’t strictly have to be five; it can vary from three to seven, as we will elaborate in the following section.
The Falling Three Methods pattern is interpreted as a sign that the downtrend is still intact, and the minor consolidation is likely a temporary pause before the price continues its downward trajectory. Traders often use this pattern to reaffirm their bearish bias in a downtrending market.
The trigger for entering a trade based on the Rising Three Methods pattern is typically when the price breaks out below the low of the final bearish candlestick in the pattern. This breakout indicates that the bearish momentum is resuming, confirming the pattern’s potential continuation signal.
Falling Three Methods Pattern – Formation
The Falling Three Methods pattern is a bearish continuation formation. While this pattern typically unfolds over five days, it’s essential to recognize that strict adherence to this five-day timeframe is not necessary. There are three phases within the formation: an initial bearish phase, an intermediate bullish phase, and a final bearish phase.
Initial Phase (Single Bearish Candlestick): The first candlestick is a long bearish (red) candle that represents the prevailing downtrend.
Intermediate Phase (One to Five Bullish Candlesticks): This phase consists of a sequence of smaller bullish candles that reside within the range of the first bearish candlestick. These bullish candles indicate a minor pause or consolidation in the ongoing downtrend. Typically, this corrective period consists of approximately three candles, although it’s worth noting that there isn’t a strict rule in this aspect. The candle count can vary from one to five, with three being the most frequently observed number in practice. This intermediate bullish phase functions as a pause within the overall pattern, providing a brief retracement before the final bearish move.
Final Phase (Single Bearish Candlestick): The final candlestick is a long bearish (red) candle that breaks out of the consolidation and closes below the close of the initial bearish candle.
Rules of Identification
Prior Trend: The market should be in a clear downtrend before the Falling Three Methods pattern occurs.
First Candle: The first candle should be a bearish (red) candlestick. The candle is a strong one and must close near its lows, with relatively small or no shadows on either side.
Consecutive Bearish Candles: Look for consecutive bullish candlesticks that reside within the range of the first bearish candlestick. Typically, the number of such bullish candles is found to be three, however, they can vary between one and five. These candles represent the consolidation phase. Such bullish candles must reside within the range of the first bearish candle.
Final Candle: The final candle should be a bearish (red) candlestick. This candle breaks out of the consolidation phase. This candle closes below the lowest low of the initial bearish candle and the subsequent bullish candles.
Color: The color of the first and final candles must be red. The color of candles in between them are green.
Strong Upward Movement: The first and final candlesticks should display a significant downward movement, with relatively small or no upper shadows.
Higher Close: Final candlestick should close below the lowest low of the initial bearish candle and the subsequent bullish candles, reflecting sustained selling pressure.
Shadows: Each of the bearish candles are strong candles, which means shadows, if present, are normally small. Small shadows on the upside can be neglected.
Market Psychology
The first long bearish candle encapsulates the dominant downtrend, indicating the prevalence of selling pressure in the market. Traders who expect the downtrend to persist drive the sentiment, leading to a substantial decline in price. This phase serves as the foundation for the ensuing pattern, symbolizing a strong belief in the continuation of the ongoing downtrend.
Following the strong bearish candle, the pattern enters an intermediate phase marked by a sequence of smaller bullish candles. These bullish candles is just a temporary interruption to the ongoing downtrend. This phase unveils the presence of buyers who are attempting to counter the prevailing downtrend. Traders who had taken short positions in anticipation of a downturn might engage in short covering, contributing to the emergence of these bullish candles. While the overall sentiment remains negative due to the preceding strong bearish candle, the appearance of bullish candles within the range of the initial bearish candle indicates a minor retracement or consolidation.
The concluding phase of the pattern witnesses the emergence of another long bearish candle. This candle breaks out of the consolidation phase and closes below the close of the initial bearish candle. This concluding candle validates the continuation of the downtrend. It signifies that the efforts of the intermediate bullish phase were insufficient to shift the overall sentiment. Sellers regain dominance, pushing prices lower and affirming the earlier bearish conviction.
Overall, the Falling Three Methods pattern showcases a transition from a strong downtrend to a temporary consolidation phase and then a renewed bearish breakout. The sentiment shifts from bearish to cautious optimism and back to bearish, reflecting the psychology of traders as they assess market conditions.
How to Trade Falling Three Methods Pattern
- Identify the Downtrend: Before looking for the Falling Three Methods pattern, make sure there is a clear and established downtrend in the price chart.
- Wait for a Falling Three Methods Pattern to Emerge: Wait for the completion of the pattern.
- Entry: Entry is triggered when the final bearish candle breaches the lowest low of the initial bearish candle and the subsequent bullish candles. Traders inclined towards a more cautious approach should wait for the final candle to close. Entry is confirmed at the close of the final bearish candle. There might be a slight price retracement after the final candle. Some traders may choose to wait for these retracements to secure a better entry point. However, retracements may not occur in all instances.
- Set Stop-Loss: Traders may set stop-loss above the highest high of the intermediate bullish candles and the final bearish candle.
Traders are advised to integrate supplementary technical analysis tools like key levels, trendlines, trading volumes, and technical indicators to validate the potential continuation signal indicated by the Falling Three Methods pattern.
Trigger: When the final bearish candle breaches the lowest low of the initial bearish candle and the subsequent bullish candles.
Confirmation: When the final bearish candle closes below the lowest low of the initial bearish candle and the subsequent bullish candles.
Stop-loss: Just above the highest high of the intermediate bullish candles and the final bearish candle.
Reliability of the Pattern
The Falling Three Methods pattern is more reliable when it occurs within a well-defined and strong downtrend.
Volume Confirmation: The intermediate phase of consecutive bullish candles in the pattern is characterized by decreasing volume. Now look out for a surge in trading volume as the third candle breaks out below the low of the intermediate consolidation phase. Higher volume indicates stronger selling interest and validates the pattern’s continuation potential.
To enhance reliability, consider incorporating other technical indicators like moving averages, trendlines, and support/resistance levels. If these indicators align with the Falling Three Methods pattern, it strengthens the overall signal. By integrating these tools into your analysis, you can reduce the likelihood of being misled by false signals and enhance the overall reliability of the pattern’s interpretation.
Gallop Insights
For better results:
- Look for Falling Three Methods pattern at key levels (support & resistance levels)
- Wait for confirmation of pattern, i.e., close of the final bearish candle.
- The pattern should not be used in isolation. Traders should use it in conjunction with other technical analysis tools and indicators.