The Dark Cloud Cover pattern is a two-candle reversal formation that holds significance in technical analysis for its potential to indicate a reversal from an uptrend to a downtrend.
Envision a scenario: a persistent uptrend dominated by bulls. Abruptly, a shift takes place – the stronghold of the bulls is tested, and bears seize an opportunity to assert themselves. This scenario is encapsulated by the Dark Cloud Cover candlestick pattern.
The Dark Cloud Cover represents a prospective bearish reversal pattern. Its contrasting bullish counterpart is known as the Piercing Line. In this article, our focus will be on the bearish rendition – the Dark Cloud Cover pattern.
Dark Cloud Cover Candlestick Pattern
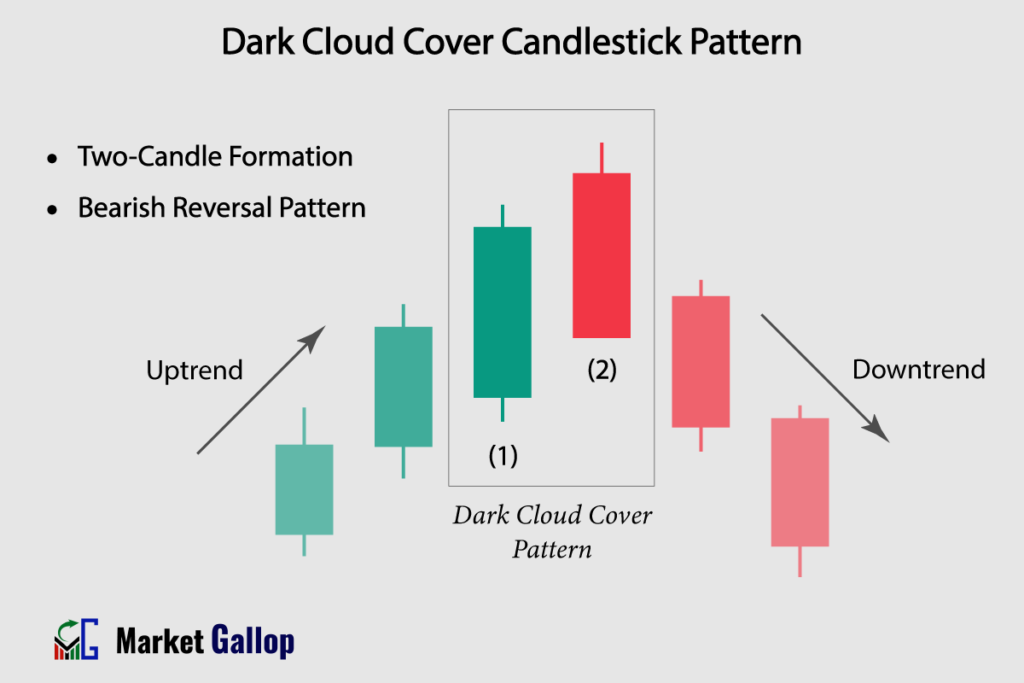
The Dark Cloud Cover Candlestick Pattern is a two-day candle formation that suggests a potential reversal from an uptrend to a downtrend.
It’s formed when a bullish candlestick is followed by a bearish candlestick that pierces into the body of the bullish candle and closes at least halfway into its body. This pattern suggests a potential change in market sentiment from bullish to bearish.
Dark Cloud Cover Pattern – Formation
Dark Cloud Cover is a two-candle reversal formation.
First Candlestick (Bullish): The first candle is a bullish (green) candlestick and have a substantial bullish body. This candle indicates that buyers were in control during the session, pushing prices upward. It represents a continuation of the existing uptrend.
Second Candlestick (Bearish): The second candle should be bearish (red). It opens above the high of the first candle. The bearish candle’s closing price should be below the midpoint (50%) of the first candle’s body.
Rules of Identification
Prior Trend: The market should be in a clear uptrend before the Dark Cloud Cover pattern occurs.
First Candle: The first candle should be a bullish (green) candlestick and reflects the continuation of the uptrend.
Second Candle:The second candle should be a bearish (red) candlestick and opens above the high of the first candle but closes below the midpoint of the first candle’s body. The body of the bearish candle should ideally be larger than the body of the first bullish candle.
Color:The color of the first candle must be green, and the second candle must be red.
Shadows: The primary focus of the pattern is on the candle bodies. Small shadows can be neglected.
Market Psychology
The first candle is a bullish candlestick with a substantial bullish body. This candle reveals that buyers have been dominant during the trading session, pushing prices upward. The candle’s substantial body conveys a significant buying interest, reflecting the continuation of the existing uptrend. This candle represents optimism and confidence among buyers, suggesting that the trend is likely to persist.
The bearish candlestick that follows the bullish one embodies a change in sentiment. Its opening above the high of the first candle symbolizes an attempt by buyers to extend the rally. However, the bearish candle’s closing price, falling below the midpoint (50%) of the first candle’s body, reveals a shift in market psychology. This bearish candle has managed to retrace a significant portion of the gains made by the preceding bullish candle. This retracement suggests that the bullish momentum has weakened, and the bears are attempting to exert control
Traders interpret the Dark Cloud Cover pattern as a change in the prevailing market sentiment. The initial optimism of buyers is met with resistance from sellers, leading to a possible reversal in the trend. This shift in sentiment is crucial for traders to identify, as it helps them anticipate a potential reversal in price direction.
How to Trade Dark Cloud Cover Pattern
- Identify the Uptrend: Before looking for Dark Cloud Cover pattern, make sure there is a clear and established uptrend in the price chart.
- Wait for the Dark Cloud Cover to Emerge: Wait for the completion of candles 1 and 2.
- Entry: Once the pattern is confirmed, observe the behavior of the subsequent candles. Once the lowest low of candles 1 & 2 is breached, the entry is triggered. However, traders adopting a more cautious approach should wait for the closure of subsequent candles. Once a subsequent candle close below the lowest low of candles 1 & 2, the entry is confirmed.
- Set Stop-Loss: Traders may set stop-loss above the highest high of candles 1 and 2.
To enhance the reliability of the Piercing Line pattern’s potential reversal signal, traders frequently employ supplementary technical analysis tools like key support levels, trendlines, volume analysis, and technical indicators. This practice minimizes the risk of false signals and bolsters the overall credibility of the pattern.
Trigger: When the price of subsequent candles breaches the low of the entire Dark Cloud Cover pattern.
Confirmation: Subsequent candles must close below the low of the entire Dark Cloud Cover pattern.
Stop-loss: Just above the high of the entire Dark Cloud Cover pattern.
Reliability of the Pattern
The Dark Cloud Cover pattern demonstrates a higher level of bearishness in comparison to the Bearish Meeting Line. However, it is not as strongly bearish as the Bearish Engulfing pattern.
The patterns appearing on higher timeframes (weekly or monthly) are more reliable. Watch out for such patterns appearing near key resistance levels.
Combining the Dark Cloud Cover with support levels, trendlines, and other Technical Analysis tools can enhance its reliability.
Gallop Insights
For better results:
- Look for Dark Cloud Cover pattern at key levels (support & resistance levels)
- Wait for confirmation of pattern, i.e., close of a subsequent candle below the lowest low of the pattern.
- Avoid relying solely on the pattern; instead, combine it with various technical analysis tools and indicators for a more comprehensive analysis.