The Downside Tasuki Gap Candlestick Pattern is a bearish continuation pattern that is a part of Japanese candlestick charting techniques. This pattern typically consists of three candlesticks and is often interpreted as a signal that an ongoing bearish trend is likely to continue.
The bearish implications of the Downside Tasuki Gap Pattern stem from the fact that the bullish attempt to reverse the trend is thwarted, indicating that sellers are still in control. This pattern is seen as a potential selling opportunity, suggesting that the bearish momentum is likely to continue after the brief consolidation or correction.
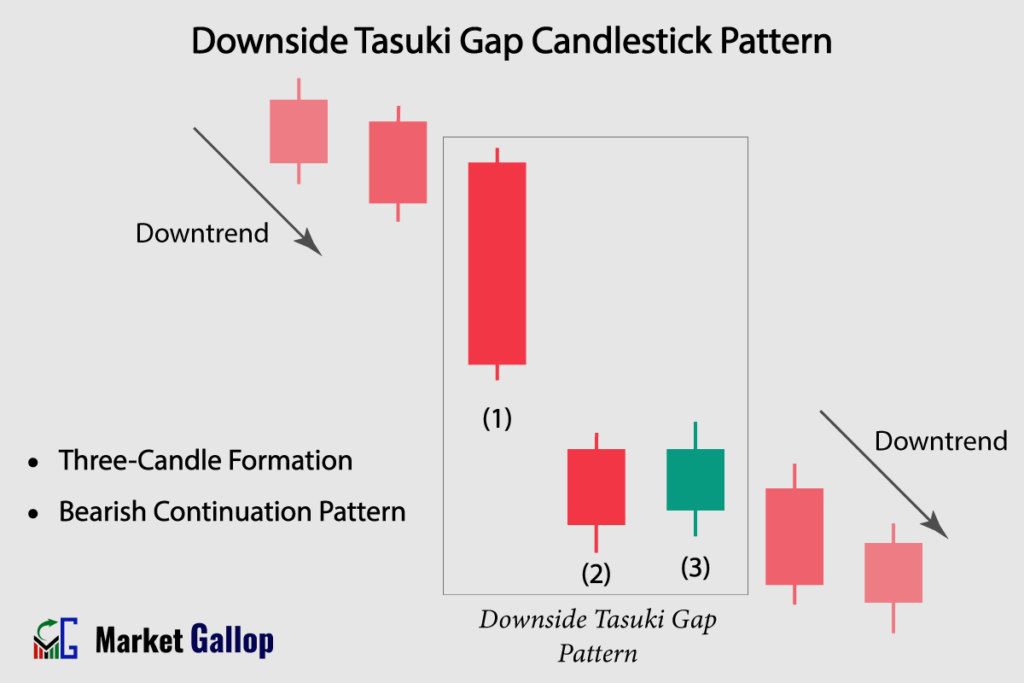
Downside Tasuki Gap Candlestick Pattern
The Downside Tasuki Gap is a bearish continuation candlestick pattern that emerges within an existing downtrend. This pattern is composed of a combination of three candlesticks: one long bearish candle followed by another small bearish candle that opens with a gap down, and a third bullish candle that opens within the body of the second candle.
The pattern begins with a strong bearish candlestick, representing the prevailing downtrend. Following this, there is a smaller bearish candlestick that gaps down and closes below the previous long bearish candle. This smaller candlestick creates a “downside gap,” which is a gap between the closing price of the previous candle and the opening price of the current candle.
The third candlestick, however, is a bullish candlestick opening within the body of the second bearish candlestick and ultimately closing above it. This bullish candlestick’s attempt to fill the gap created by the second bearish candlestick signifies a temporary pause or correction within the trend. Nevertheless, the inability of the bullish candlestick to completely close the gap or window suggests that the bearish sentiment remains strong.
Downside Tasuki Gap Pattern – Formation
The Downside Tasuki Gap pattern is a three-candle bearish continuation formation.
First Candlestick (Bullish): The first candlestick is a long bearish (red) candle that closes near its low price of the day.
Second Candlestick (Bearish): The second candlestick is a small bearish (red) candle that opens with a gap below the close of the first bearish candle. This candle, which gaps down on the open, is the one that creates the “downside tasuki gap.”
Third Candlestick (Bullish): The third candlestick is a small bullish (green) candle that opens within the body of the second bearish candle and closes above it. This candle has the potential to partially fill the gap created by the second bearish candle. However, it is unable to completely breach the gap, which functions as a strong resistance level.
Rules of Identification
Prior Trend: The market should be in a clear downtrend before the Downside Tasuki Gap pattern occurs.
First Candle: The initial candle should be a bearish (red) candlestick. This candle is of substantial length and must close near its lows, with relatively small or no shadows on either side.
Second Candle: The second candle should also be a bearish (red) candlestick. It opens with a gap down from the first candle and closes lower. It is relatively smaller in comparison to the first candle.
Third Candle: The final candle should be a bullish (green) candlestick. This candle opens within the body of the second candle. It moves towards the gap above, and may partially fill the gap. It closes above the second candle; however, it is unable to completely fill the gap.
The Gap: The first and second candle creates a gap in between them. This gap acts as a resistance to the third (bullish) candle.
Color: The color of the first and second candles must be red. The color of the third candle is green.
Shadows: Small shadows on either side can be ignored.
Market Psychology
The first candle, displaying a lengthy bearish body and a close near its session low, signifies a prevailing negative sentiment and an established downtrend in the market. Sellers have been dominant in this session, pushing prices downwards.
Following the initial strong bearish candlestick, a smaller candlestick appears that gaps down and closes lower than the previous candle. This phase further underscores the prevalence of the bearish sentiment.
The pattern concludes with a bullish candlestick that opens within the body of the previous bearish candle and closes above it. Though the market attempts to rise, it encounters stiff resistance at the prior gap or window. Notwithstanding the presence of a bullish candlestick, its inability to completely breach the gap suggests that the buying pressure is limited. If the window formed by the gap is not violated by the bullish candlestick’s high, it indicates that sellers are still maintaining their control.
The appearance of a bullish candlestick during the final phase is seen as a temporary pause in the bearish trend, rather than a reversal. Its inability to violate the gap, highlights the resilience of the bearish sentiment. If the window created by the gap remains intact, traders may view the appearance of the Downside Tasuki Gap Pattern as a potential selling opportunity.
How to Trade Downside Tasuki Gap Pattern
- Identify the Downtrend: Before looking for the Downside Tasuki Gap pattern, make sure there is a clear and established downtrend in the price chart.
- Wait for the Downside Tasuki Gap Pattern to Emerge: Wait for the completion of the pattern.
- Entry: Observe the next candle (i.e., the candle after the bullish candle) following the formation of the pattern. Entry is triggered when the fourth candle breaches the low of the bullish candle. However, more conservative traders should wait for the fourth candle to close. Entry is confirmed when the fourth candle closes below the lowest low of the entire Downside Tasuki Gap pattern.
- Set Stop-Loss: Traders may set stop-loss above the gap or window formed between first and second bearish candles.
Traders are recommended to incorporate additional technical analysis tools, such as key levels, trendlines, trading volumes, and technical indicators to confirm the potential reversal signal suggested by the Downside Tasuki Gap pattern.
Trigger: When the fourth candle breaches the low of the bullish candle.
Confirmation: When the fourth candle closes below the lowest low of the entire pattern.
Stop-loss: Just above the gap between first and second bearish candles.
Reliability of the Pattern
The reliability of the pattern increases when it occurs within a strong and well-established downtrend. Furthermore, if the gap is violated on the upside, it indicates strong buying pressure and renders the pattern invalid.
Combining the Downside Tasuki Gap pattern with other technical analysis tools, such as moving averages, trendlines, and momentum oscillators, can provide additional confirmation and enhance the reliability of the pattern.
Gallop Insights
For better results:
- Look for Downside Tasuki Gap pattern at key levels (support & resistance levels)
- Wait for confirmation of pattern, i.e., close of the fourth candle.
- The pattern should not be used in isolation. Use it in conjunction with other technical analysis tools and indicators.