The Tweezers Top candlestick pattern is a two-day bearish reversal formation that emerges at the culmination of an uptrend. It is often regarded as a signal indicating a potential weakening of the upward momentum, suggesting the possibility of a bearish reversal in the market.
The Tweezers Top pattern highlights a possible turning point in the market sentiment. It alerts traders to the fact that the upward momentum is stalling and that bearish forces might gain prominence. The pattern shows that despite attempts to push prices higher, the market encounters resistance at a certain level. This resistance can be attributed to profit-taking by traders who have benefited from the uptrend. The presence of resistance suggests a potential reversal in the making.
Tweezers Top Candlestick Pattern
The Tweezers Top candlestick pattern is a two-day candle formation that emerges at the end of an uptrend, indicating a possible shift from bullish to bearish momentum.
This pattern is identified by two or more candlesticks displaying identical or nearly identical highs in the price chart. The consecutive identical high suggest that buying pressure may be weakening, and sellers might be stepping into the market.
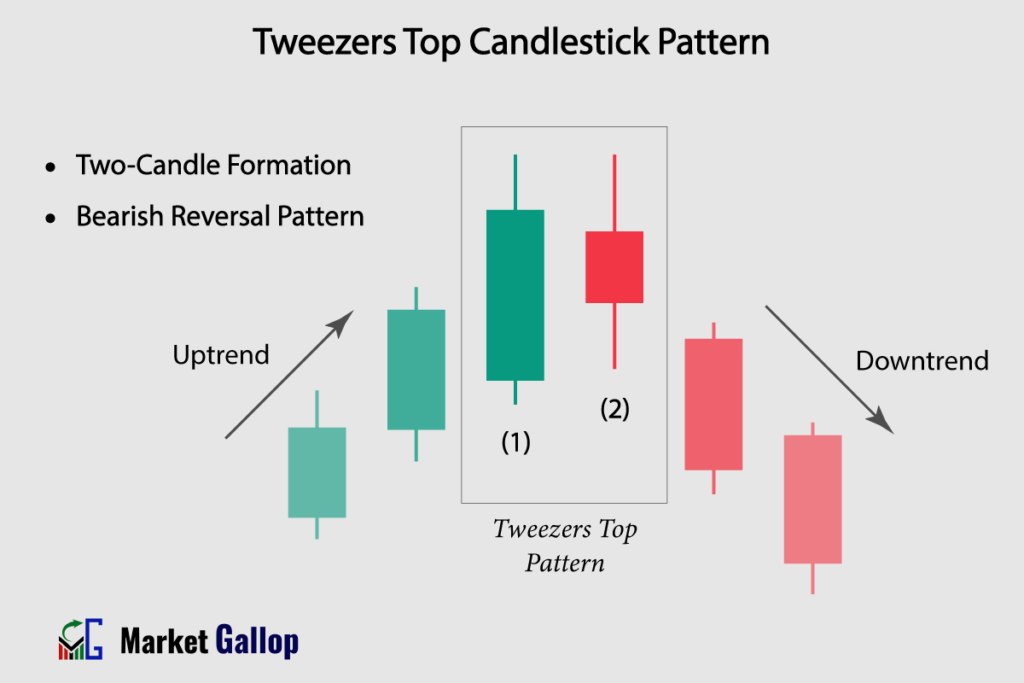
Tweezers Top Pattern – Formation
The Tweezers Top pattern is a two-candle reversal formation.
First Candlestick (Generally Bullish): Typically, the first candle is a bullish (green) candlestick with an upper shadow. However, in rare cases, it can also be a doji candle or a bearish (red) candle with an upper shadow. The presence or absence of lower shadows does not matter. This candle indicates that while the market sentiment remains positive, sellers are present at higher price levels.
Second Candlestick (Bearish, Bullish or a Doji): The second candle can be a bearish (red), bullish (green) or a doji candle as long as it’s high is at the same level as the first candle’s high. This candle indicates the inability of buyers to push prices above than the previous high and the continued presence of sellers at higher price levels.
Possibility of Additional Candlesticks: In certain scenarios, there may be a presence of more than two candles. The validity of the pattern exists as long as the high of such additional candles are at the same levels as the first two candles.
Rules of Identification
Prior Trend: The market should be in a clear and prolonged uptrend before the Tweezers Top pattern occurs.
First Candle: The first candle is typically a bullish (green) candlestick and in rare instances, a bearish (red), or a doji candle.
Second Candle: The high of the second candle should match or closely match the high of the first candle. The second candle can be a bearish (red), bullish (green), or a doji candle, as long as its high is at the same level as the high of the previous candle.
Additional Candles: The highs of multiple candles, if any, should match the highs of candles 1 and 2.
Color: The color of the first candle is green most of the time; however, in some instances, it is red. The color of the second candle does not matter.
Shadows: The primary focus of the pattern is on the candle highs. The presence or absence of shadows does not matter. However, the highs of the candles should be at the same level.
Market Psychology
Traders interpret the Tweezers Top pattern as a warning of a possible trend reversal. The pattern signifies that the resistance level has managed to thwart buyers’ attempts to push prices higher, indicating a potential change in sentiment.
The first candle, often bullish, signals an existing positive sentiment in the market. However, the upper shadow indicates that even though buyers are active and pushing prices up, they encounter resistance at higher levels. This resistance, often indicated by the upper shadow, could be the result of profit-taking or strong presence of the sellers at these elevated price points.
The high of the second candle matches the high of the first candle, indicating that buyers were unable to push prices any higher than what was achieved with the first candle. This lack of progress by buyers suggests a weakening in their influence or possibly a lack of conviction. Importantly, it also highlights the presence of sellers at the higher price levels.
Collectively, these characteristics – the inability of buyers to extend the upward movement and the presence of sellers stepping in at those levels – point toward the possibility of a change in market sentiment.
How to Trade Tweezers Top Pattern
- Identify the Uptrend: Before looking for Tweezers Top pattern, make sure there is a clear and established uptrend in the price chart.
- Wait for a Tweezers Top Pattern to Emerge: Wait for the completion of candles 1 and 2. In some instances, more than two candles may exhibit the same behavior (i.e., more than two candles with highs at the same level).
- Entry: Once the pattern is confirmed, observe the behavior of the subsequent candles. Entry is triggered when the lowest low of candles 1 & 2 (or additional candles with the same high) is breached. However, more conservative traders should wait for subsequent candles to close. Entry is confirmed when a subsequent candle closes below the lowest low of candles 1 & 2 (or additional candles with the same high).
- Set Stop-Loss: Traders may set stop-loss above the highest high of candles 1 and 2 (or additional candles with same high).
In order to validate the potential reversal indicated by the Tweezers Top pattern, traders frequently incorporate additional technical analysis tools. They include key resistance levels, trendlines, volume analysis, and technical indicators. This approach helps mitigate the risk of false signals and enhances the overall reliability of the pattern.
Trigger: When the price of subsequent candles breaches the low of the entire Tweezers Top pattern.
Confirmation: Subsequent candles must close below the low of the entire Tweezers Top pattern.
Stop-loss: Just below the low of the entire Tweezers Top pattern.
Reliability of the Pattern
The pattern’s formation near a crucial resistance levels can enhance the probability of a bearish reversal. The pattern is more reliable when it forms at the end of a sustained uptrend.
Tweezers Top patterns that materialize on longer timeframes, such as weekly or monthly charts, tend to carry higher reliability. Their effectiveness can be further bolstered when confirmed by supplementary technical analysis tools.
Gallop Insights
For better results:
- Look for Tweezers Top pattern at key levels (support & resistance levels)
- Wait for confirmation of the pattern, i.e., the close of a subsequent candle above the lowest low of the pattern.
- It should be used in combination with other technical analysis tools and indicators.