Trend analysis in the stock market refers to the process of examining and identifying the prevailing direction or trajectory of price movements for a particular financial asset or the market as a whole. The goal is to identify and align with the prevailing market sentiment, whether it is bullish, bearish, or neutral.
What is Trend Analysis?
Trend analysis is a fundamental aspect of technical analysis that involves studying the historical price movements of a financial asset to identify and understand the prevailing direction of the market.
The primary objective of trend analysis involves assessing whether prices are predominantly moving upward (uptrend), downward (downtrend), or horizontally (sideways or range-bound) and whether they are short-term (minor), medium-term (secondary), or long-term (major) in nature.
It also aims to gauge the strength of a trend and recognize potential trend reversal points where the prevailing direction may change. It makes use of other technical analysis tools such as support and resistance levels, trendlines, and channels to identify potential areas of price interaction.
Trend analysis also involves utilizing technical indicators and volume analysis for further confirmation of the identified trends.

What is a Trend?
A trend in the financial markets refers to the general direction in which the prices of a particular asset or the market as a whole are moving over a certain period of time.
A market can only move in three directions – up, down, or sideways. But still, it is not easy to directly identify the direction of the market for most traders. Why? It is because markets never move in a straight line in any direction. The movements of the market are always characterized by a series of zigzags.
These zigzags are similar to a wave, a wave with multiple peaks and troughs. Technical analysis defines the direction of a trend based on the direction of such successive peaks and troughs.

Types of Trend (Based on Direction)
Based on the directional bias of price movements, trends can be classified into three types:
- Uptrend
- Downtrend
- Sideways Trend (Range-bound)
Uptrend
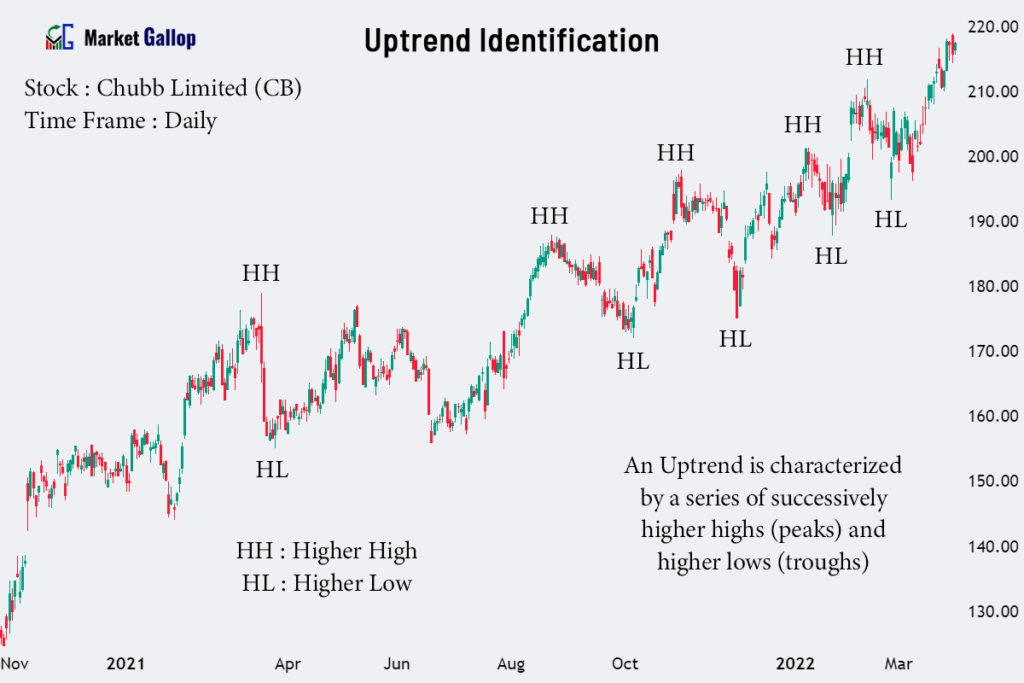
An uptrend in the stock market refers to a sustained and consistent upward movement in the prices of financial assets over a defined period. During an uptrend, the prevailing direction of price movements is characterized by higher highs and higher lows, indicating an overall positive momentum.

Uptrends are often associated with periods of economic expansion and positive business conditions, leading to an increase in corporate earnings and stock prices. Investors exhibit confidence in the financial markets, anticipating further price appreciation during these periods. With growing demand, they are ready to buy assets at even higher prices.
Downtrend
A downtrend in the stock market refers to a sustained and consistent downward movement in the prices of financial assets over a defined period. During a downtrend, the prevailing direction of price movements is characterized by lower highs and lower lows, indicating overall negative momentum.

Downtrends are often associated with economic contractions, poor business conditions, or negative external factors contributing to a decline in corporate earnings and stock prices. Negative investor sentiment prevails during these periods, leading to a lack of demand, further contributing to the decline in asset prices.
Sideways Trend (Range-bound) or Trendless Market
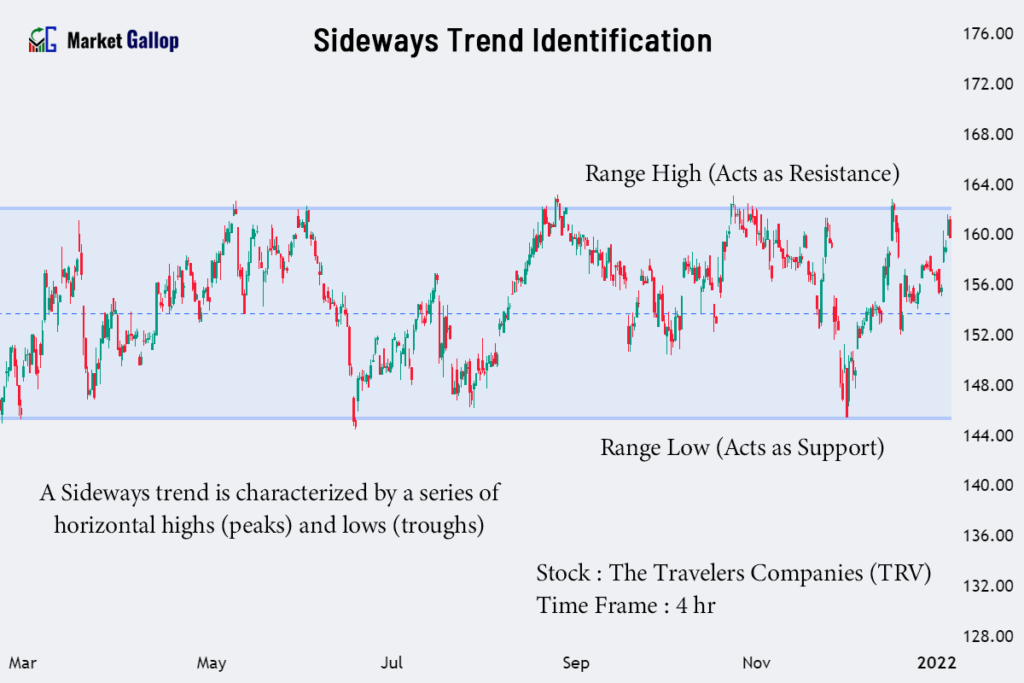
A sideways trend, also known as a horizontal or range-bound market, refers to a phase in the stock market where the prices of financial assets move within a relatively narrow and well-defined range, with no clear overall upward or downward direction. During a sideways trend, the price movements are characterized by equal or near-equal highs and lows.

Traders and investors may exhibit indecision, reflecting a balanced sentiment between buyers and sellers. Trading volumes may be lower compared to trending markets, as there is a lack of a clear directional bias. Market participants may be awaiting new information or a catalyst to establish a clear trend. Price action within a sideways trend can be choppy, with frequent back-and-forth movements.
Classification of Trend (Duration)
In addition to the types based on direction, there are three categories of trend that are based upon the time period it exists. They are:
- Primary (Major) Trend
- Secondary (Intermediate) Trend
- Minor (Short Term) Trend

Primary (Major) Trend
The primary (major) trend represents the overall direction of the market or a particular financial asset over an extended period, often measured in years. It can be an uptrend, downtrend, or sideways trend.
Of these three categories, the primary trend is the dominant and most influential, providing a long-term indication of market movements. Bear in mind, these are major trends in the market, and they typically last from several months to several years.
Position traders typically focus on these long-term trends and may hold positions for an extended period, aligning with the primary trend’s direction. They aim to capture substantial market movements over months to years.
Secondary (Intermediate) Trend
Secondary trends are the shorter-term countertrend movements (secondary reactions) that occur within the primary trend. These reactions are temporary price reversals, such as corrections in an upward trend or brief rallies in a downward trend.
The secondary trend, also known as an intermediate trend, lasts for a few weeks to several months.
Swing traders often focus on these secondary trends, as they seek to capture shorter-term price swings within the context of the primary trend. They aim to enter and exit positions during these corrective movements or rallies, taking advantage of both upward and downward swings.
Minor (Short Term) Trend
Minor trends are even shorter-term movements, often seen as minor fluctuations or noise within the secondary trend.
The minor trend, or short-term trend, typically lasts from a few days to a few weeks.
Day traders and short-term speculators may pay attention to the minor trend. They operate within the intraday time frame, capitalizing on these minor trends and fluctuations occurring within a single trading day.
Trend Identification
Identifying and analyzing trends in the financial markets is essential, as it helps traders and investors determine when to enter or exit positions. Furthermore, it serves as the basis for developing and applying trading strategies in the market.
Trend identification (trend analysis) methods include peak and trough analysis, trendlines, price channels, moving averages, and technical indicators, including various oscillators.
1. Peak and Trough Analysis
Technical Analysis primarily defines a trend using peak and trough analysis. This concept revolves around identifying the highest points (peaks) and lowest points (troughs) in a financial asset’s price movement over time.
Bear in mind, this peak and trough analysis has its fair share of critics, and it will be discussed later.
Uptrend
An uptrend is characterized by a series of successively higher highs (peaks) and higher lows (troughs).
The price chart exhibits an upward-sloping movement, forming a staircase pattern. Bullish sentiment prevails in an uptrend as buyers dominate, pushing prices higher.
Downtrend
A downtrend is characterized by a series of successively lower highs (peaks) and lower lows (troughs).
The price chart displays a downward-sloping movement, forming a descending staircase pattern. Bearish sentiment prevails in a downtrend as sellers dominate, pushing prices lower.

Sideways Trend (Trendless market)
A sideways trend is characterized by a series of horizontal highs (peaks) and lows (troughs), often forming a horizontal range.
The price chart shows a flat or nearly flat pattern, indicating that neither buyers nor sellers have a dominant influence. Neutral sentiment prevails in a sideways trend as the market lacks a clear directional bias.
Criticism against Trend identification using peak and trough analysis
Markets may not always move in definite patterns and ways predicted by peak and trough analysis. Furthermore, extreme or chaotic price movements may make it difficult or impossible to identify the prevailing trend through this method alone.
Financial markets are inherently noisy, and short-term fluctuations can create false signals in peak and trough analysis. Traders relying solely on this may misinterpret noise as a significant trend reversal.
Another significant criticism is the subjective nature of identifying peaks and troughs. Different analysts may identify turning points differently, leading to subjective interpretations and potential discrepancies in trend identification.
Less often, peak and trough analysis is sensitive to the timeframe chosen for analysis. Different timeframes can result in varying interpretations of peaks and troughs, leading to potential discrepancies in trend identification.
2. Trend Identification using Trendlines
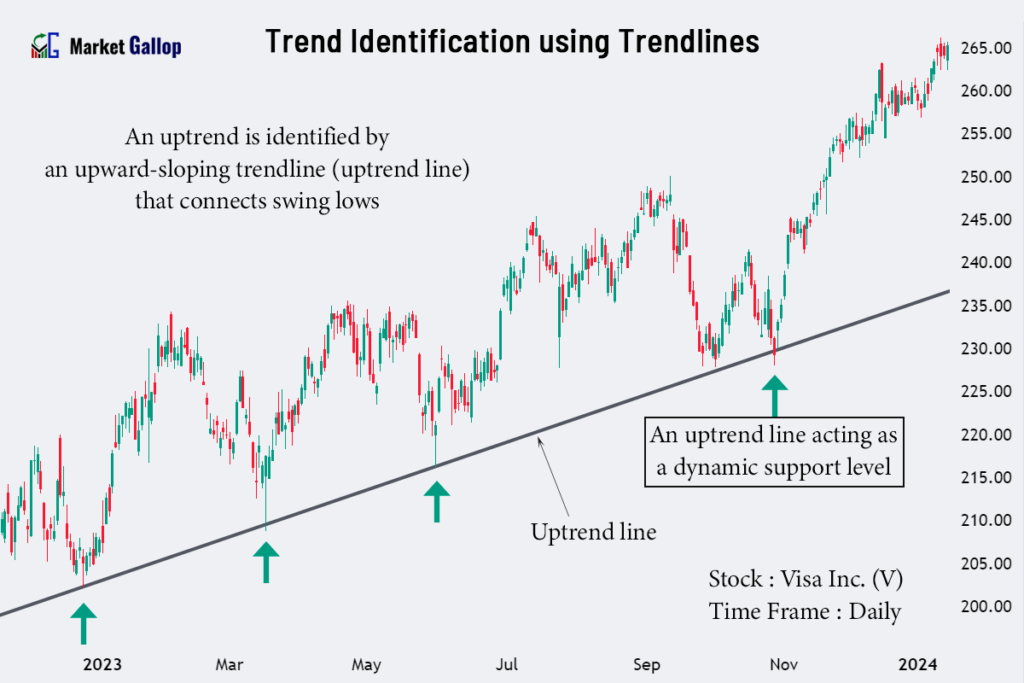
Trend Analysis also incorporates trendlines as a tool to confirm and identify the direction of a trend. Trendlines are lines drawn on a price chart connecting consecutive highs or lows.
- An uptrend is identified by an upward-sloping trendline (uptrend line) that connects swing lows.
- A downtrend is identified by a downward-sloping trendline (downtrend line) that connects swing highs.
To draw an uptrend line, one connects a series of higher lows on the price chart, indicating a pattern of ascending lows over time. This suggests an overall upward movement in prices, and traders interpret it as an uptrend (bullish).
Conversely, a downtrend line is drawn by connecting a series of lower highs on the chart, reflecting a pattern of descending highs. This signals an overall downward movement in prices, and traders view it as a downtrend (bearish).
These trendlines also serve as dynamic levels of support and resistance on a price chart.
Support in Uptrend: An uptrend line drawn in an uptrend acts as a dynamic support level. During price pullbacks, the asset’s price tends to find support near or along the trendline.
Resistance in Downtrend: A downtrend line drawn in a downtrend acts as a dynamic resistance level. During price rallies, the asset’s price encounters resistance near or along the trendline.
3. Trend Identification using Moving Averages
Trend Analysis also makes use of Moving Averages to confirm the direction of a trend.
A moving average (MA) is a widely used technical indicator in technical analysis, providing a smoothed representation of price data that helps identify the overall direction of the trend.
There are different types of moving averages, but the two most common are the Simple Moving Average (SMA) and the Exponential Moving Average (EMA). Common periods include 50 days, 100 days, and 200 days.
Since the topic of moving averages is vast and beyond the scope of this article, we will provide you with some basic guidelines on using it for trend identification.
Slope of Moving Average: A moving average that is sloping upward indicates an uptrend, while a downward slope suggests a downtrend. A horizontal moving average suggests a sideways trend.
Crossover: The intersection of the price chart with a moving average is known as a crossover. An upward crossover in higher period MAs suggests a potential uptrend, while a downward crossover indicates a potential downtrend. When the price fluctuates around the moving average, resulting in frequent crossovers, it suggests a potential sideways trend.
200-Day Moving Average: In an uptrend, the asset’s price consistently trades above its 200-day moving average. In a downtrend, the asset’s price consistently trades below its 200-day moving average.
Golden Cross: This occurs when a short-term moving average crosses above a long-term moving average, signaling a potential uptrend. For example, a 50-day moving average crosses above a 200-day moving average.
Death Cross: On the other hand, a Death Cross happens when a short-term moving average crosses below a long-term moving average, indicating a potential downtrend. For example, a 50-day moving average crosses below a 200-day moving average.
Like trendlines, moving averages also act as dynamic levels of support and resistance on a price chart.
Support in Uptrend: Moving averages act as dynamic support in uptrends, with prices often bouncing off the moving average during pullbacks.
Resistance in Downtrend: In downtrends, moving averages act as dynamic resistance, with prices facing selling pressure near the moving average during rallies.

4. Trend Identification using Technical Indicators
Trend analysis involves using technical indicators to confirm the strength of a trend. Momentum indicators, such as the Relative Strength Index (RSI) and Moving Average Convergence Divergence (MACD), help assess the strength and momentum of a trend.
However, other than measuring the strength of a trend, they also provide key indications about the prevailing trend. Let’s consider the case of RSI indicator.
RSI is a momentum oscillator often used to identify overbought or oversold conditions. In an uptrend, RSI values above 70 may indicate overbought conditions, while in a downtrend, RSI values below 30 may suggest oversold conditions.
But what does RSI indicate about the existing trend? For that, we have to consider the ranges in which RSI spends time during trends.
- During an uptrend, RSI generally stays in the range of 40-90. It rarely breaks below the value of 30 but may frequently cross above 70.
- During a downtrend, RSI generally stays in the range of 10-60. It rarely breaks above the value of 70 but may frequently cross below 30.
During an uptrend, if RSI fails to frequently cross above 70 but reaches below 30, it is an indication of the uptrend getting weaker. Similarly, during a downtrend, if RSI fails to frequently cross below 30 but reaches above 70, it is an indication of the downtrend getting weaker.

Support and Resistance Levels in Trend Analysis
Support and Resistance levels are price levels where the market has historically encountered barriers or reversals in its price movements. In trend analysis, these levels help identify key points where prevailing trends may encounter obstacles or experience reversals.
But how exactly do these levels aid in trend analysis? Let’s consider a stock that has been on an uptrend for several months. Traders and investors are benefiting from the upward movement, but they want to identify potential areas where the trend might face challenges or undergo a reversal.
So they analyze historical price data and identify significant resistance levels. As the stock approaches the resistance level, they observe how prices interact with these identified levels.
There are three scenarios that can occur here:
- Pause: When the price approaches the resistance level, it may experience a temporary pause or slowdown in its upward movement.
- Reversal: The strong resistance level can act as a reversal point, leading to a change in the prevailing trend, i.e., causing a reversal from an uptrend to a downtrend.
- Acceleration: If the resistance level is decisively breached, it may lead to a rapid acceleration in the upward movement.
Based on how exactly this scenario may play out, traders and investors adjust their strategies accordingly.
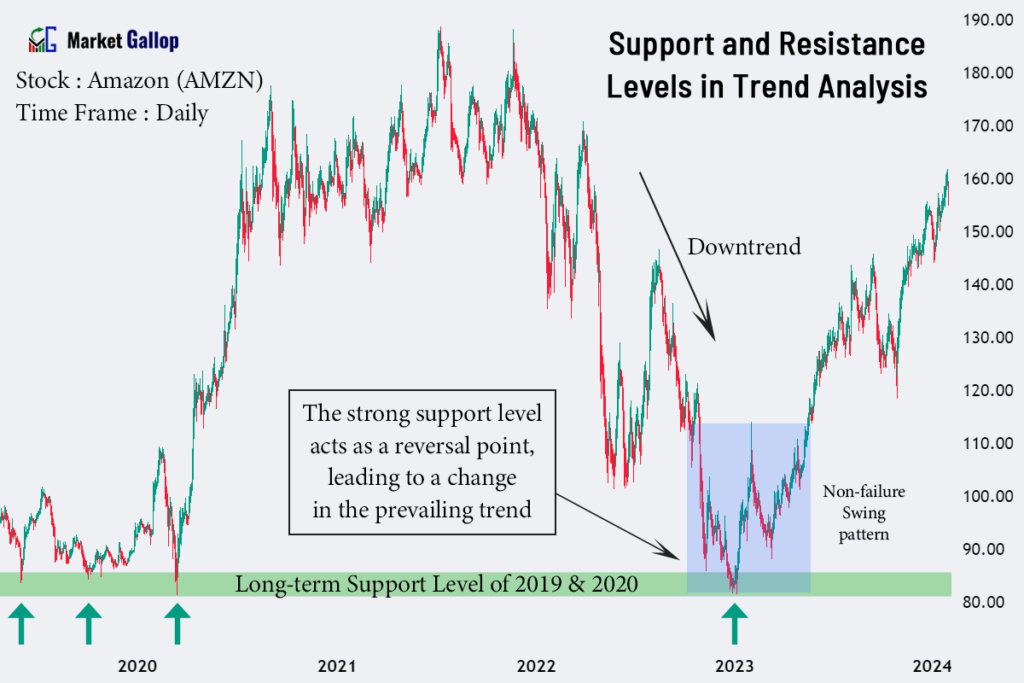
In the above chart, observe the support level that was created in Amazon stock during 2019 and 2020. Also, a downtrend can be observed in the stock from January 2022. By the end of the year, the stock prices approach the support zone.
Observe how the prices respect this support zone. The formation of a Non-failure Swing pattern can also be observed there. A downtrend has presently reversed to an uptrend.
Volume Analysis for Trend Confirmation
Volume analysis is a powerful tool in technical analysis, providing additional insights for confirming trends and identifying potential trend reversals.
In a strong uptrend, rising prices accompanied by increasing volume suggest robust buying interest. This indicates a healthy trend with market participants actively participating in the upward movement.
Similarly, in a downtrend, falling prices with rising volume indicate strong selling pressure, reinforcing the bearish sentiment and the potential continuation of the downtrend.
Divergence between price and volume provides early signals of a potential trend reversal. For example, if prices are rising but volume is decreasing, it indicates a weakening of buyer interest. Similarly, decreasing prices with declining volume signal diminishing selling pressure.
What Creates Trends in Stock Market?
Trends in the stock market are created by the imbalance between supply and demand for a particular asset. When demand exceeds supply, prices tend to rise, creating an uptrend. Conversely, when supply exceeds demand, prices tend to fall, creating a downtrend.
Various factors contribute to this supply and demand dynamics, including:
- Corporate earnings and financial performance
- Economic indicators
- Interest rates and monetary policy
- Market sentiment
- Global events and geopolitical factors
- Technological advancements and innovation
- Market psychology and behavioral factors
- Government policies and regulations
Trend Reversals
A trend reversal occurs when the prevailing direction of the market changes from its existing trend. Recognizing trend reversals in early stages provide opportunities for traders to exit existing positions and enter new positions of a developing trend.
Bearish Reversal (Uptrend to Downtrend)
A bearish reversal occurs when an ongoing uptrend loses momentum and transitions into a downtrend.
This reversal suggests a weakening of buying interest, and sellers are gaining control, potentially leading to a sustained downward movement in prices. Traders may consider initiating short positions or liquidating long positions in anticipation of the emerging downtrend.
During a bearish reversal, the prices that were making higher highs and higher lows start forming lower highs and lower lows. The prices soon break below the uptrend line that connected the swing lows.
Another key indication of a bearish reversal is a breakdown below key support levels. When prices breach a significant support level that was holding during the uptrend, it signals a potential shift in momentum.
Bearish reversal patterns include formations like double tops, head and shoulders, rising wedges, rounding tops, and diamond tops. Crossovers of moving averages, when a shorter-term moving average crosses below a longer-term moving average, also signal a potential change in trend direction.
Divergence between price movements and momentum indicators such as the Relative Strength Index (RSI), where the price continues to make new highs while the indicator fails to do so, may indicate weakening bullish momentum.
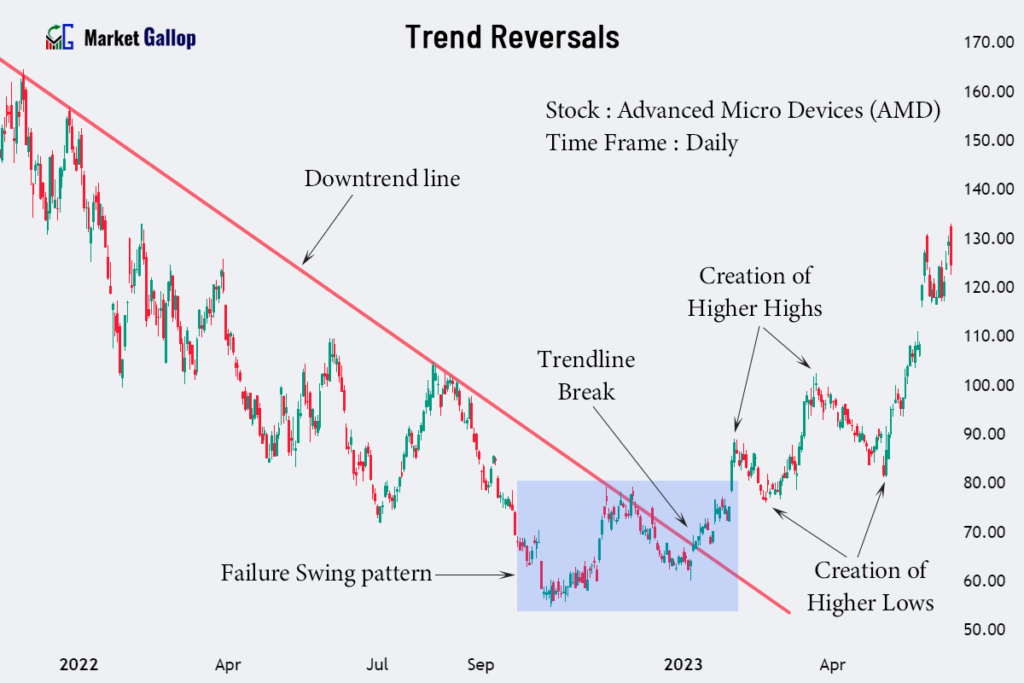
Bullish Reversal (Downtrend to Uptrend)
A bullish reversal takes place when a downtrend exhausts its downward momentum and transforms into an uptrend.
This reversal suggests that selling pressure is weakening, and buyers are gaining control, potentially leading to a sustained upward movement in prices. Traders may consider initiating long positions or adjusting short positions in anticipation of the emerging uptrend.
During a bullish reversal, the prices that were making lower highs and lower lows start forming higher highs and higher lows. The prices soon break above the downtrend line that connected the swing highs.
Another clear indication is a breakout above key resistance levels that were holding during the downtrend. This breakout signals a potential shift in market sentiment.
Bullish reversal patterns include formations like double bottoms, inverted head and shoulders, falling wedges, rounding bottoms, and diamond bottoms. Crossovers of moving averages, when a shorter-term moving average crosses above a longer-term moving average, also signal a potential change in trend direction.
Divergence between price movements and momentum indicators such as the RSI, where prices make new lows while the indicators make higher lows, can be a signal of weakening bearish momentum.
Signals of Trend Reversals
In a strong uptrend, the inability to establish new highs or, in a downtrend, the failure to make new lows may indicate a loss of momentum and potential exhaustion. As discussed above, a shift occurs in the structure of price movements, such as a series of lower highs and lower lows changing to higher highs and higher lows, or vice versa.
Patterns that indicate exhaustion, such as a climax, blow-off tops and bottoms, or exhaustion gaps, often precede trend reversals. These patterns suggest that the trend has reached an unsustainable extreme.
A climax occurs when there is a rapid and extreme move in price, often accompanied by a surge in volume. It represents a final push in the direction of the prevailing trend.
A blow-off top occurs in an uptrend when there is a sudden and sharp increase in price, followed by a rapid decline. Similarly, a blow-off bottom occurs in a downtrend with a sharp decline followed by a quick rebound.
Exhaustion gaps occur when there is a significant gap between the closing price of one day and the opening price of the next, signaling a rapid and extreme move. These gaps often mark the end of a trend.
Range Breakouts (Sideways to Uptrend or Downtrend)
A range breakout occurs when the price of a financial asset moves outside a well-defined trading range. A trading range is characterized by a period during which the price of an asset fluctuates between established upper and lower boundaries, forming a horizontal channel.
The breakout occurs when the price breaches either the upper resistance level or the lower support level of the range. These breakouts are often considered important signals by traders as they suggest the potential for a new trend to emerge.
Successful range breakouts are usually accompanied by increased trading volume. Volume confirmation adds validity to the breakout, indicating strong market participation and support for the new trend direction.
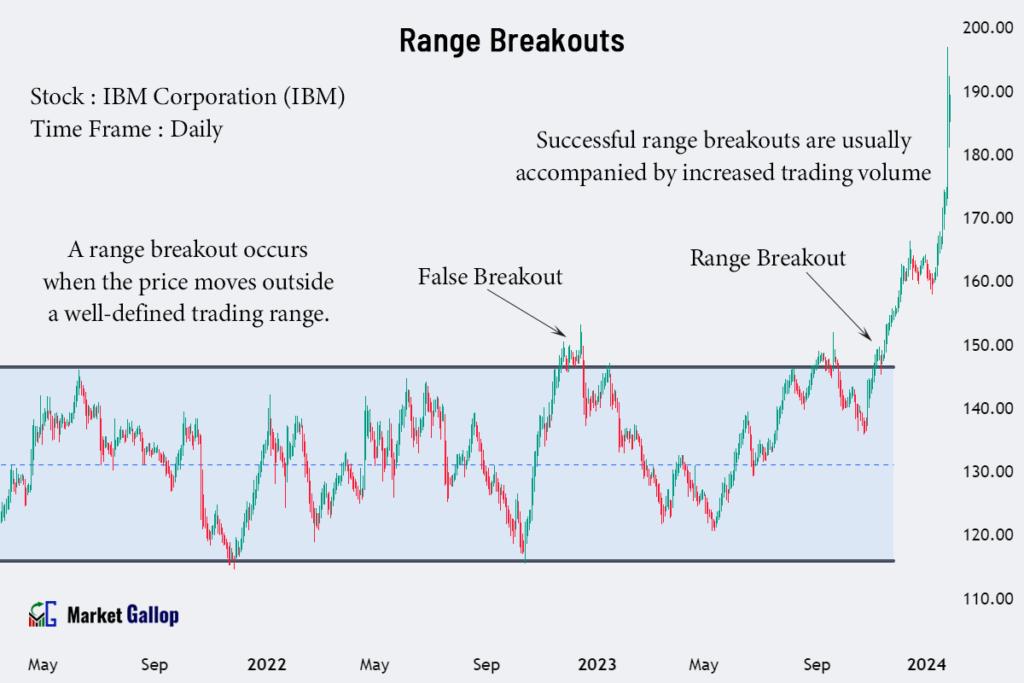
It’s important to note that not all range breakouts may lead to new trends. False breakouts can occur, where the price briefly moves beyond the range boundaries but fails to maintain the momentum and falls back inside the range.
In some instances, the breakout might result in just an expansion of the existing trading range (range expansion) without a clear and sustained directional move. Range expansion means the highs and lows of the price movements extend beyond the previous boundaries of the trading range, creating a larger price range.
Benefits of Trend Analysis
Identify Market Trends: Trend analysis helps in recognizing the prevailing direction of price movements, whether it’s an uptrend, downtrend, or sideways trend.
Forecast Future Price Movements: By understanding historical price patterns, trend analysis provides insights into potential future price movements.
Risk Management: Recognizing the direction of the trend allows traders to manage risk effectively. They can align their positions with the prevailing trend, reducing the likelihood of making trades against the market direction.
Entry and Exit Points: Trend analysis assists in determining optimal entry and exit points for trades. Traders can aim to enter positions during the early stages of a trend and exit before a potential reversal, maximizing profits.
Avoid Noise and False Signals: By focusing on the broader trend, traders can filter out short-term market noise and false signals. This allows for a clearer understanding of the market’s primary direction.
Improve Trading Psychology: Understanding market trends contributes to better trading psychology. Traders and investors can approach the market with confidence and discipline, reducing emotional decision-making.
Strategy Development: Traders use trend analysis to develop trading strategies that align with the dominant market direction, increasing the probability of successful trades.