The Three Black Crows is a bearish reversal candlestick pattern that occurs in technical analysis, indicating a potential reversal of an uptrend. This pattern consists of three consecutive bearish candlesticks, each with progressively lower closing prices.
The Three Black Crows pattern suggests that sellers have gained control over the market and are overpowering the buyers. The increasing selling momentum indicated by the consecutive lower closes signifies a shift in sentiment from bullish to bearish.
Three Black Crows Candlestick Pattern
The Three Black Crows Candlestick Pattern is a three-candle pattern that often indicates a potential bearish reversal following an uptrend or a phase of sideways movement within the uptrend.
The Three Black Crows pattern is characterized by a series of three strong, and relatively large bearish candles with consecutively lower closes. This pattern is recognized as a strong reversal signal and indicates a potential shift from an uptrend to a downtrend in the market.
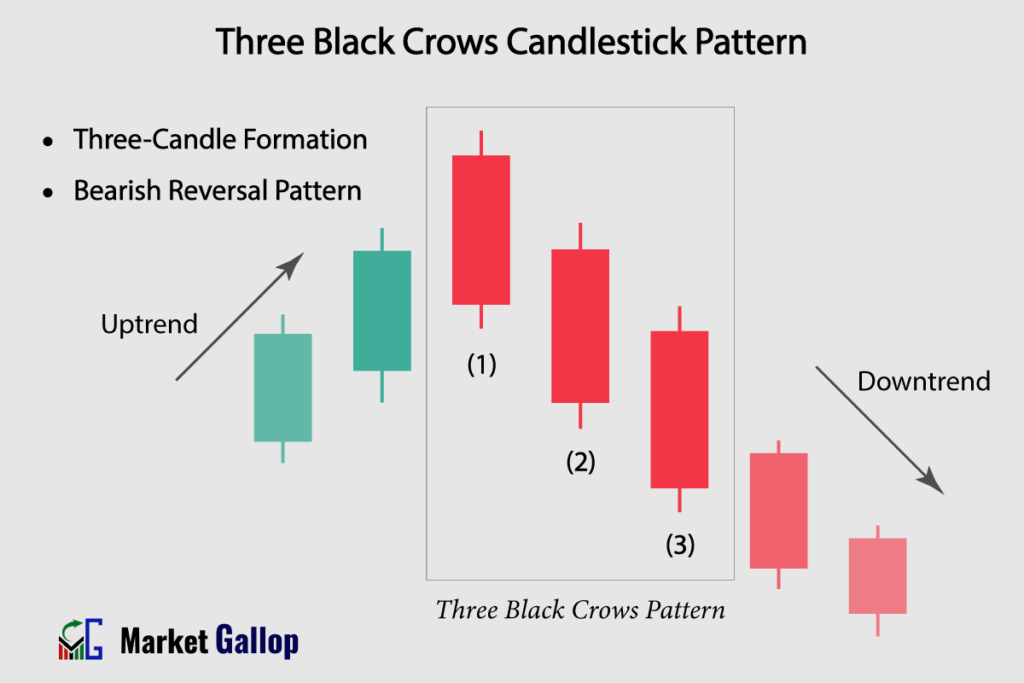
Three Black Crows Pattern – Formation
The Three Black Crows pattern is a three-candle reversal formation.
First Candlestick (Bearish): The first candlestick is a bearish (red) candle that closes near its low price of the day. It suggests that sellers have entered the market and are able to push the price lower from the opening level.
Second Candlestick (Bearish): The second candlestick typically opens within the body of the previous candle and closes lower, near its low of the day. It demonstrates a continuation of selling momentum from the previous session.
Third Candlestick (Bearish): The third candlestick follows a similar pattern. It typically opens within the body of the second candle and closes near its low. This candlestick reaffirms the selling pressure, indicating very weak demand for the asset.
Rules of Identification
Prior Trend: The market should either be in a clear uptrend or in a period of sideways momentum within the uptrend before the Three Black Crows pattern occurs.
Three Consecutive Bearish Candlesticks: Look for three consecutive bearish candlesticks on a price chart.
First Candle: The first candle should be a bearish (red) candlestick. The candle must close at or near its lows, with relatively small or no upper shadows.
Second Candle:The second candle should be a bearish (red) candlestick and typically opens within the body of the first candle. However, an open a little lower than the previous candle’s body is also valid. The candle must close at or near its lows, with relatively small or no upper shadows.
Third Candle: The third candle should be a bearish (red) candlestick and typically opens within the body of the second candle. Like the previous candle, an open a little lower than the previous candle’s body is also valid. The candle must close at or near its lows, with relatively small or no upper shadows.
Color:The color of the first, second and third candles must be red.
Strong Upward Movement: Each of the three candlesticks should display a significant downward movement, with relatively small or no lower shadows.
Higher Closes: Each candlestick should close at or near its low price of the day, reflecting sustained selling pressure.
Shadows: Each of the bearish candles must close at or near its lows, which means either there are no shadows on the lower side, or shadows, if present, are normally small. Small shadows on the upper side can be neglected.
Market Psychology
The Three Black Crows pattern reflects a consistent pattern of decreasing prices and is a clear indication of a change in market sentiment. It suggests that the bulls (buyers) are losing control, and the bears (sellers) are taking charge.
The first candlestick, which opens and closes in bearish territory near its low, indicates the halt in the buying momentum. This signifies that sellers are actively participating and have managed to push the price lower compared to the opening level. This initial surge in selling activity establishes a foundation for the subsequent trend. The close near the low underscores the sellers’ control and dominance during the session.
The second candlestick extends the bearish sentiment. Its opening typically occurs within the body of the previous candle, indicating that the selling momentum from the first session is spilling over. As the candle progresses, it achieves a lower closing price near its day low. This candlestick signifies that the bearish sentiment has persisted beyond a single session and is potentially gaining traction.
The third candlestick follows a similar pattern as the second one. Opening within the range of the second candle, it reinforces the theme of bearish continuation. Its downward journey culminates in a closing price that hovers near the low of the day. This closing level near the low points to a strong commitment from sellers and a prevailing bearish sentiment.
Traders interpret the Three Black Crows pattern as a strong indicator of a bearish trend reversal. The pattern’s formation reflects a gradual erosion of buyer confidence and a mounting conviction among sellers. It’s as if the sellers’ determination grows with each candle, overshadowing any attempts by buyers to counter the downward momentum.
How to Trade Three Black Crows
- Identify the Uptrend: Before looking for the Three Black Crows pattern, make sure there is a clear and established uptrend in the price chart. In some instances, the market may exhibit sideways behavior within the uptrend, without violating the uptrend.
- Wait for a Three Black Crows Pattern to Emerge: Wait for the completion of candles 1, 2, and 3.
- Entry: Observe the behavior of the third bearish candle. Entry is triggered at the third bearish candle. However, more conservative traders should wait for third candle to close. Entry is confirmed at the close of third bearish candle. There might be a slight price pullback after the third candle. Some traders may choose to wait for these pullbacks to secure a better entry point. However, pullbacks may not occur in all instances.
- Set Stop-Loss: Traders may set stop-loss above the high of the first bearish candle, i.e., above candle 1.
Traders are advised to utilize additional technical analysis tools, including key support levels, trendlines, volume analysis, and technical indicators, to validate the potential reversal indicated by the Three Black Crows pattern. Employing these tools helps diminish the risk of false signals and bolsters the overall reliability of the pattern.
Trigger: When the third candle exhibit satisfactory bearish behavior.
Confirmation: At the close of third bearish candle.
Stop-loss: Just above the high of the entire Three Black Crows pattern.
Reliability of the Pattern
Make sure that the Three Black Crows pattern appears after a prolonged uptrend. This increases the pattern’s reliability as a bearish reversal signal.
Patterns that appear on longer timeframes, such as the weekly or monthly charts, are more reliable. Keep an eye out for these formations near key resistance levels.
Similar to other candlestick patterns, this pattern can also produce false signals. Always account for the broader market context, adopt sound risk management strategies, and brace for unexpected market movements.
To further bolster the reliability of the pattern, consider integrating supplementary technical analysis tools like resistance levels, trendlines, and technical indicators.
Gallop Insights
For better results:
- Look for Three Black Crows pattern at key levels (support & resistance levels)
- Wait for confirmation of pattern, i.e., close of the third bearish candle.
- The pattern should not be used in isolation. Use it in conjunction with other technical analysis tools and indicators.